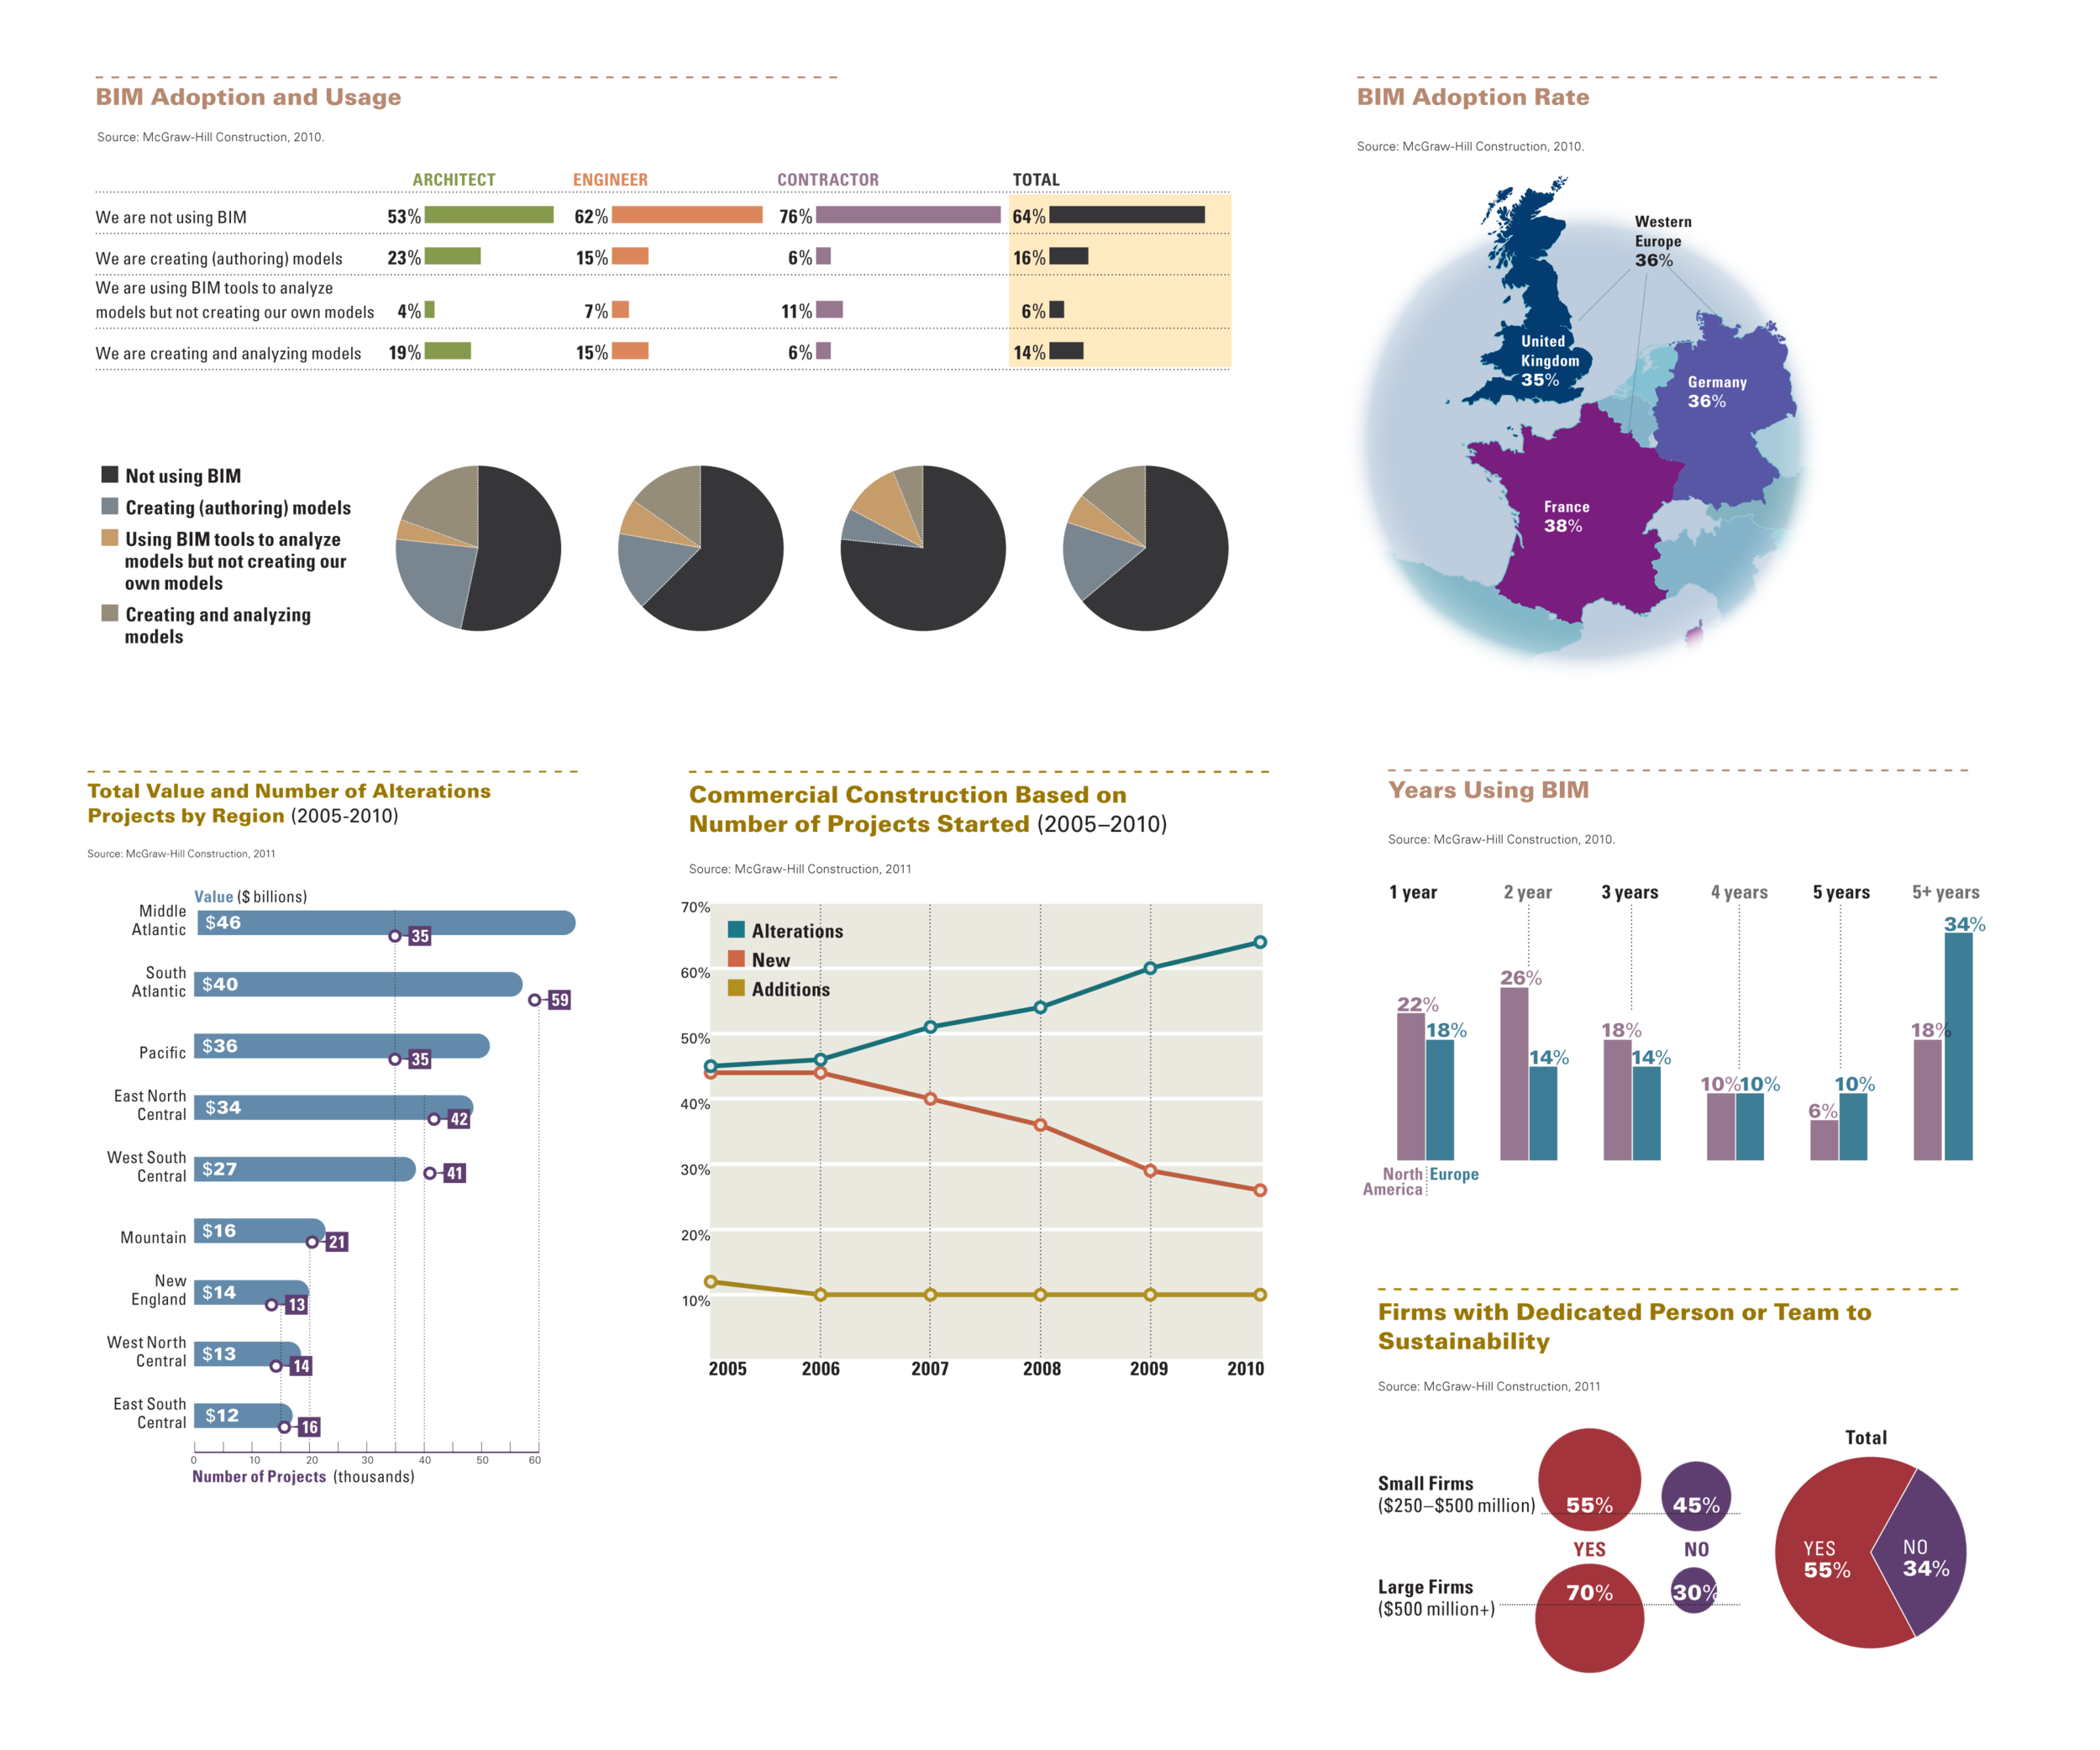
For the redesign of SmartMarket Reports, I established styles and color palettes for different information design approaches.
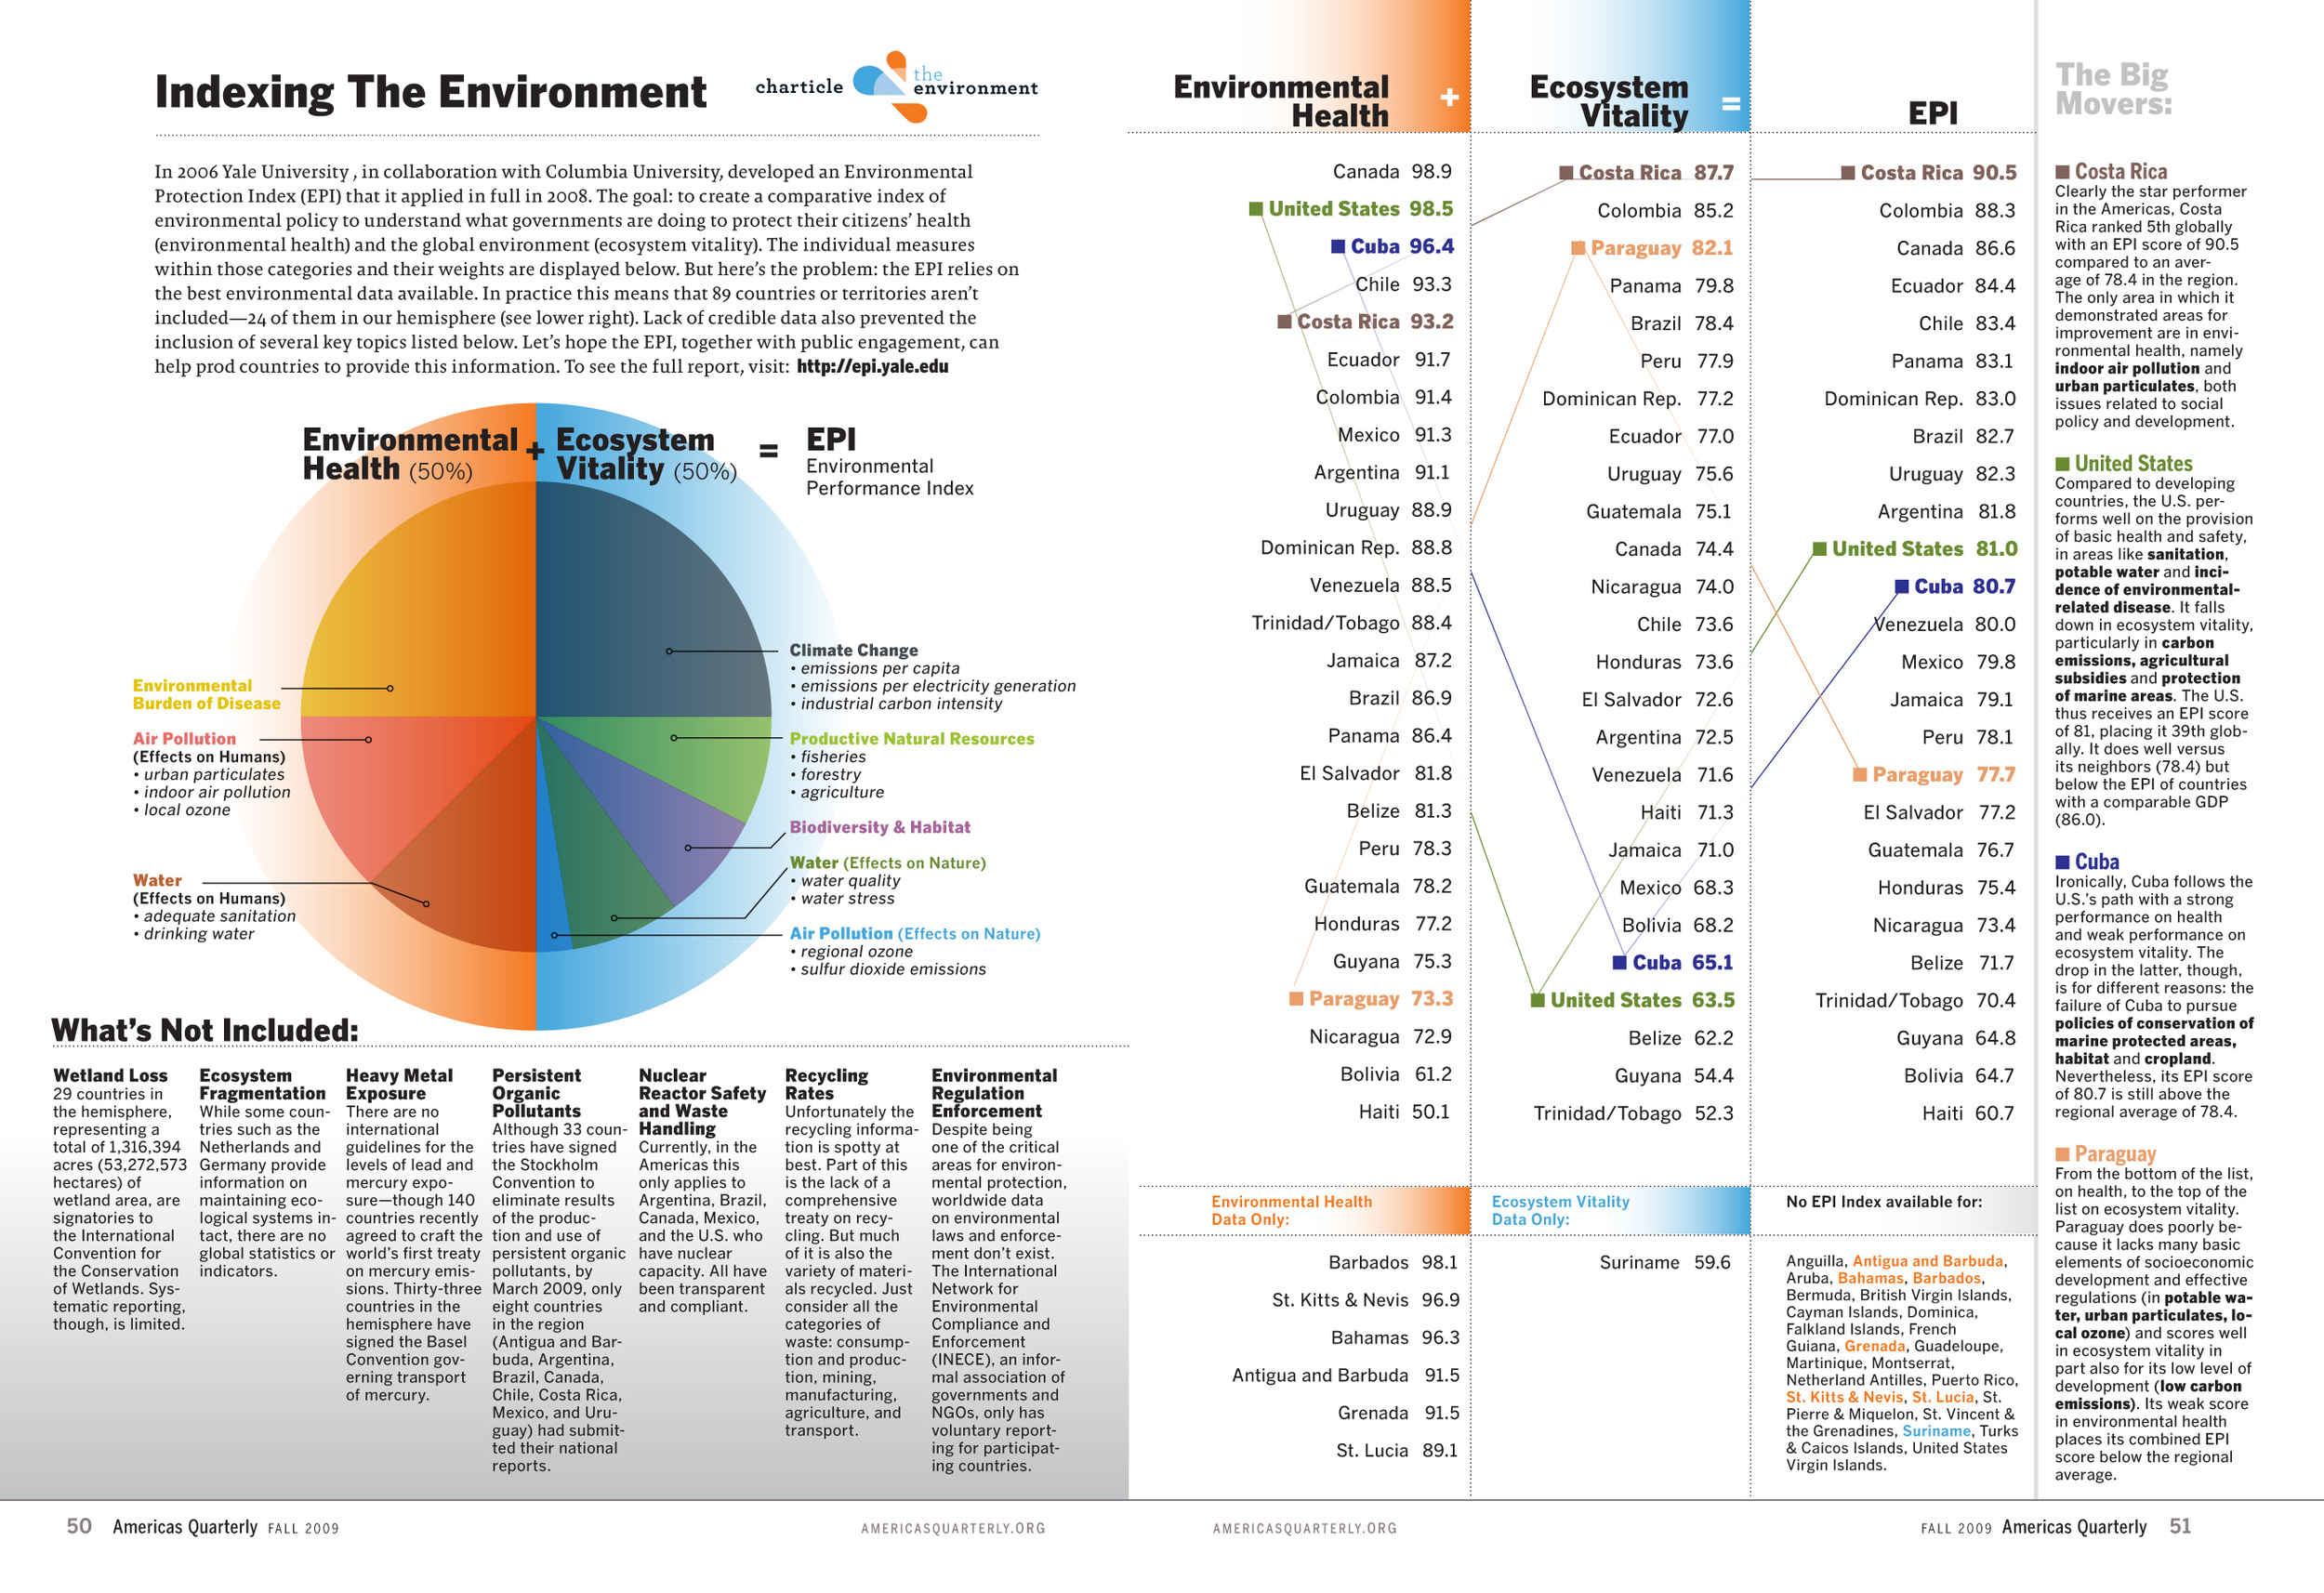
Spread I designed for Americas Quarterly explaining how eco-friendly countries are
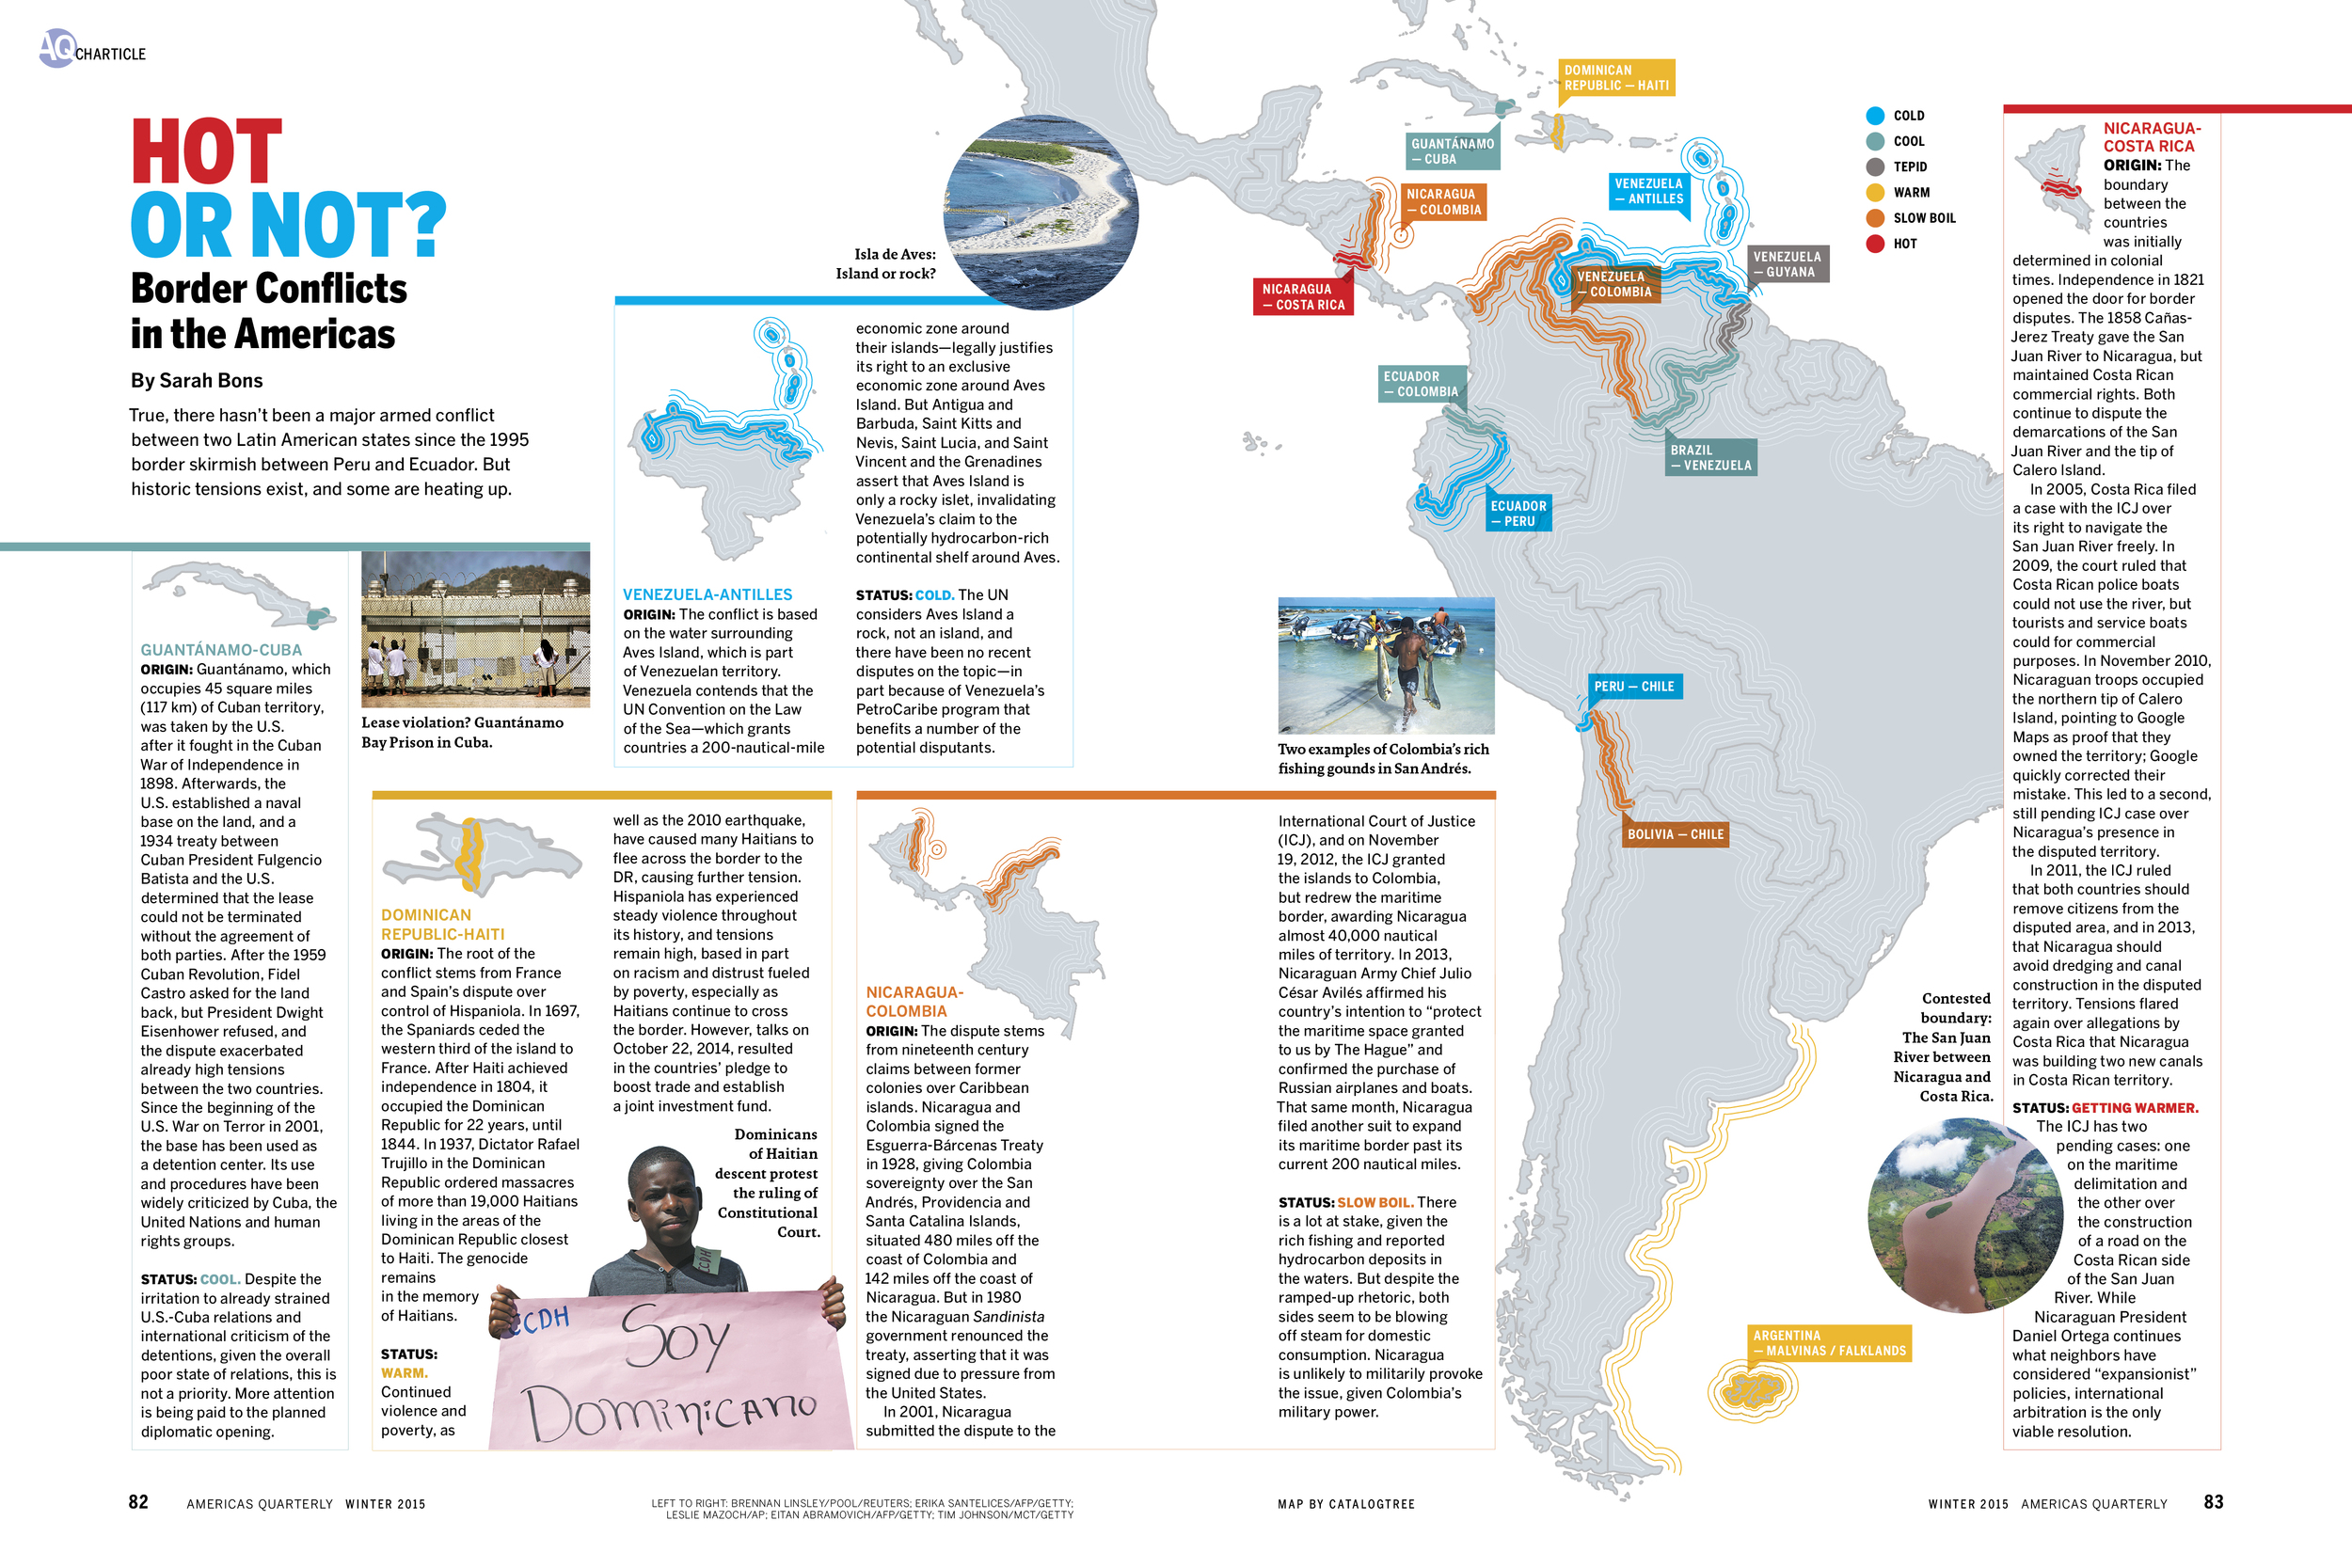
I commissioned Catalogtree to illustrate a map showing Latin American border conflicts and their intensity
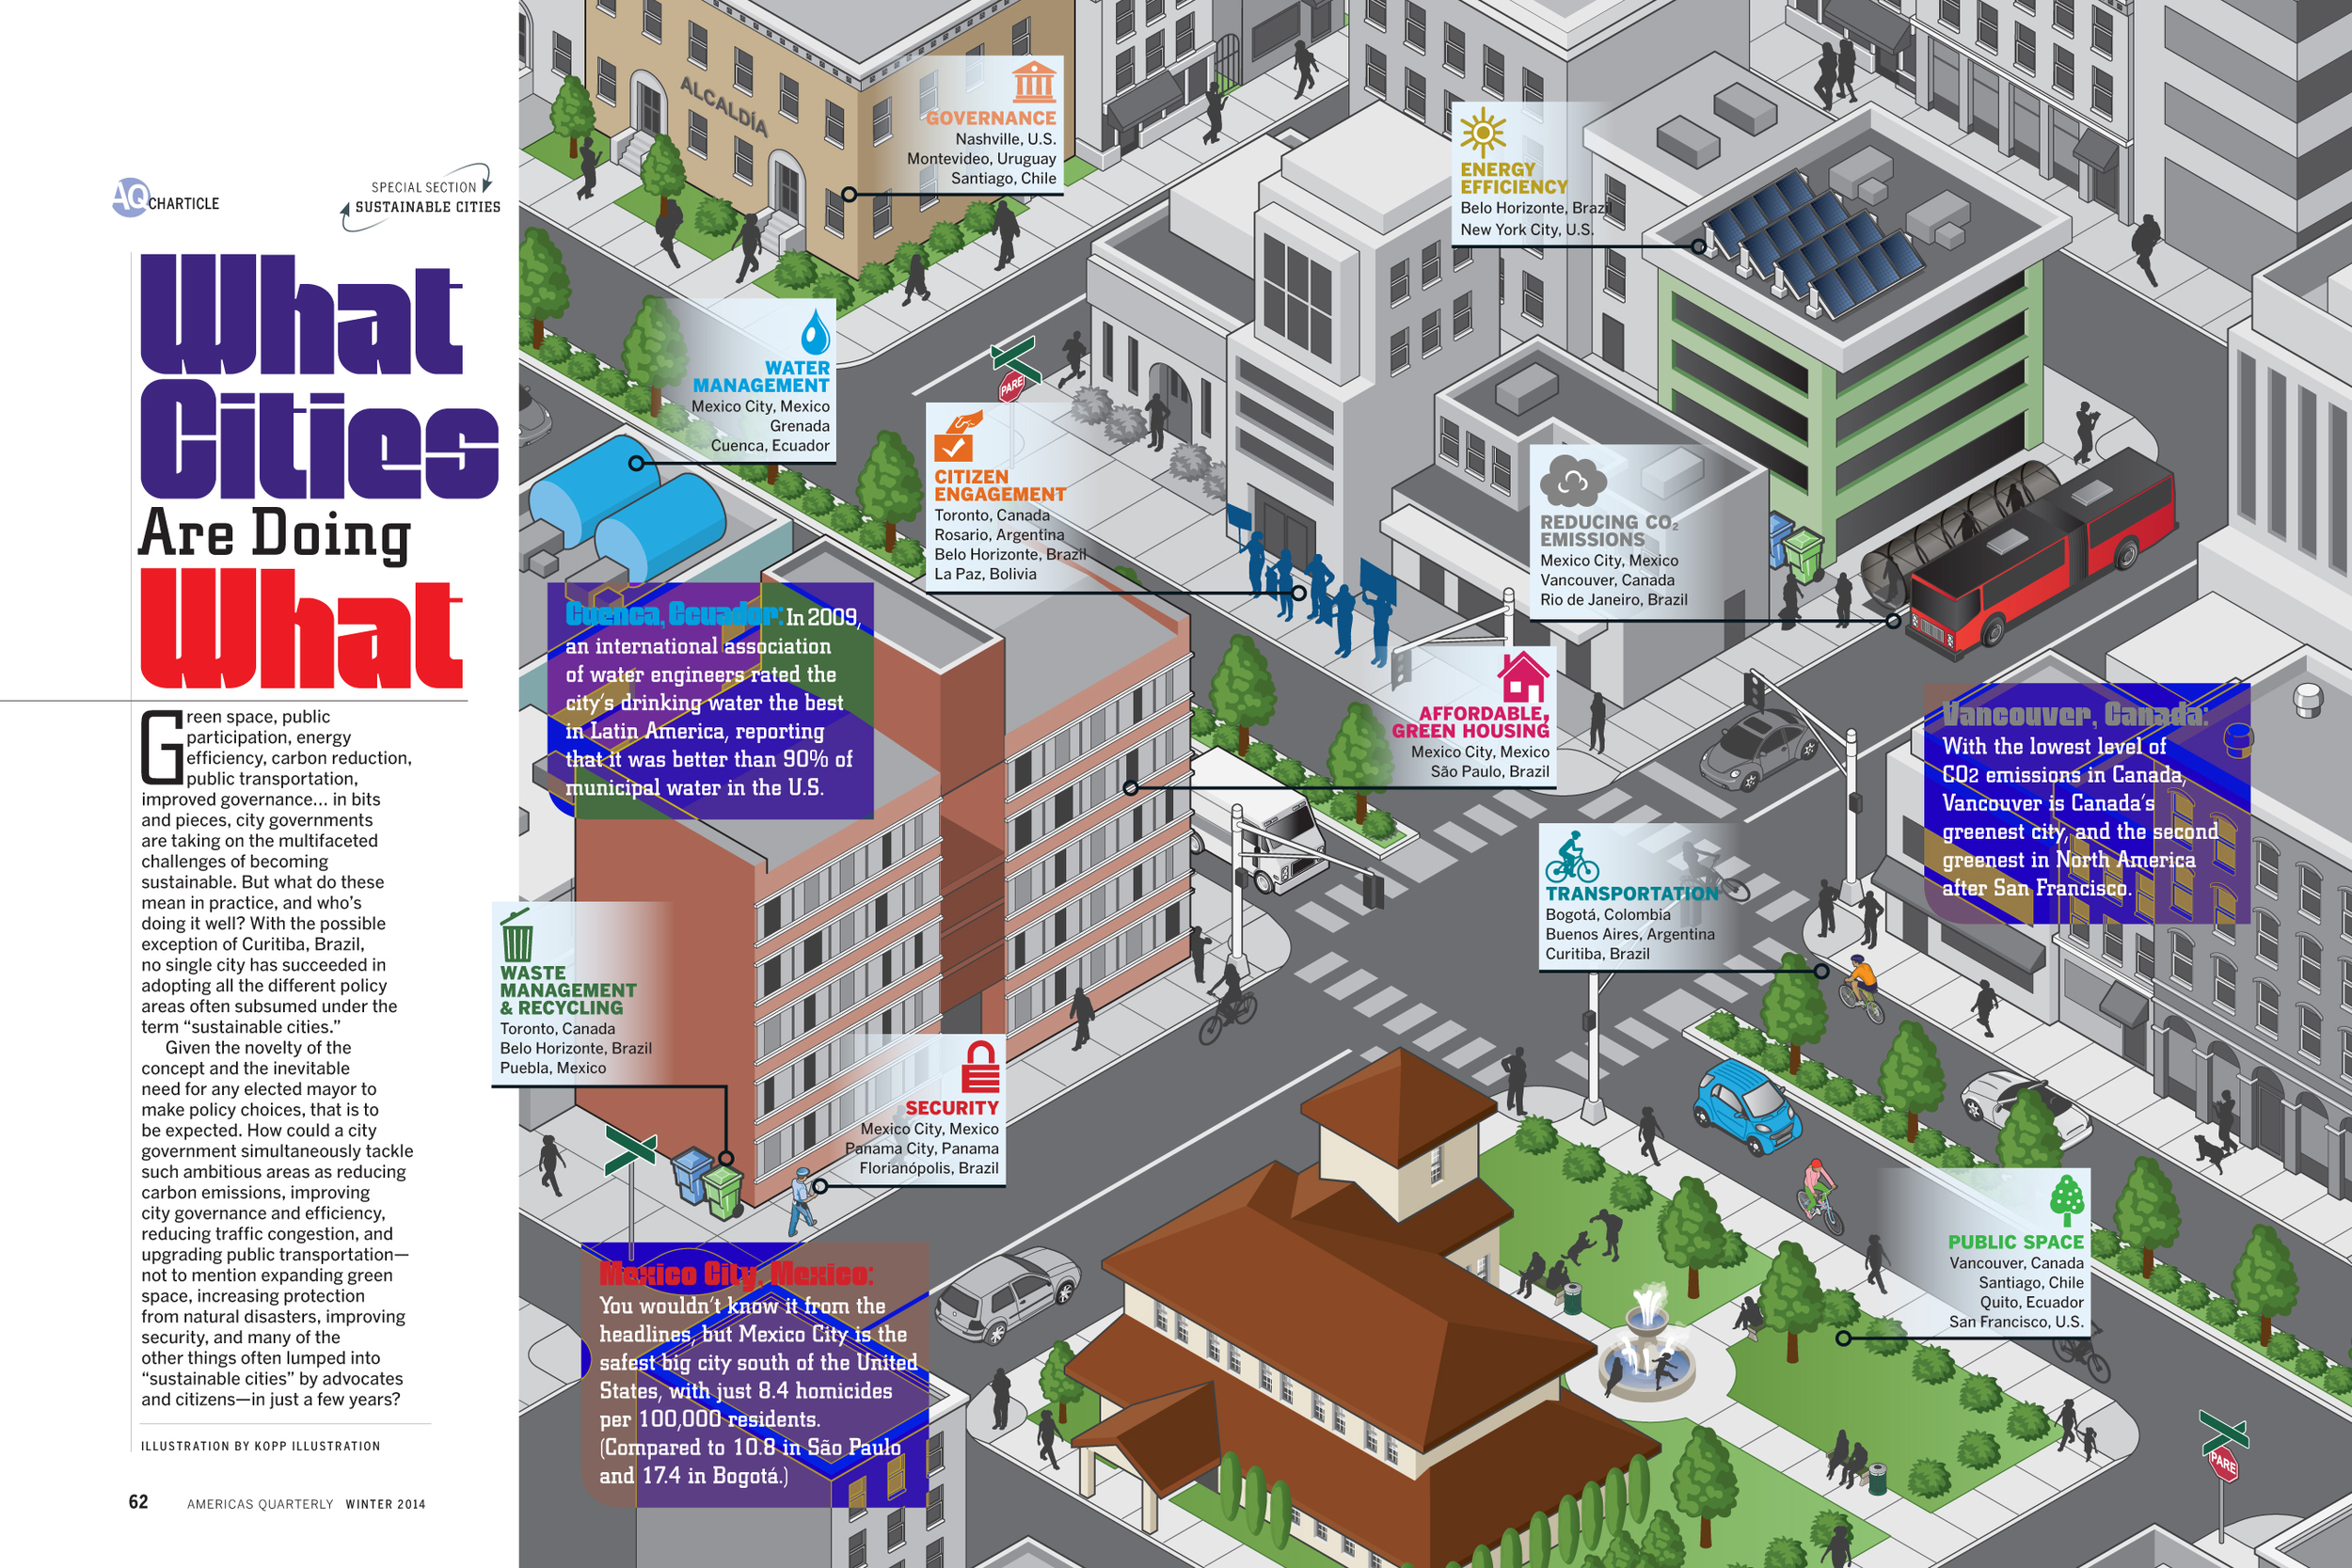
Kopp Illustration helped to design this spread in Americas Quarterly showing steps cities have taken to be more eco-friendly

The restrictions and dangers to journalists in different countries. Icons by Our Designs.
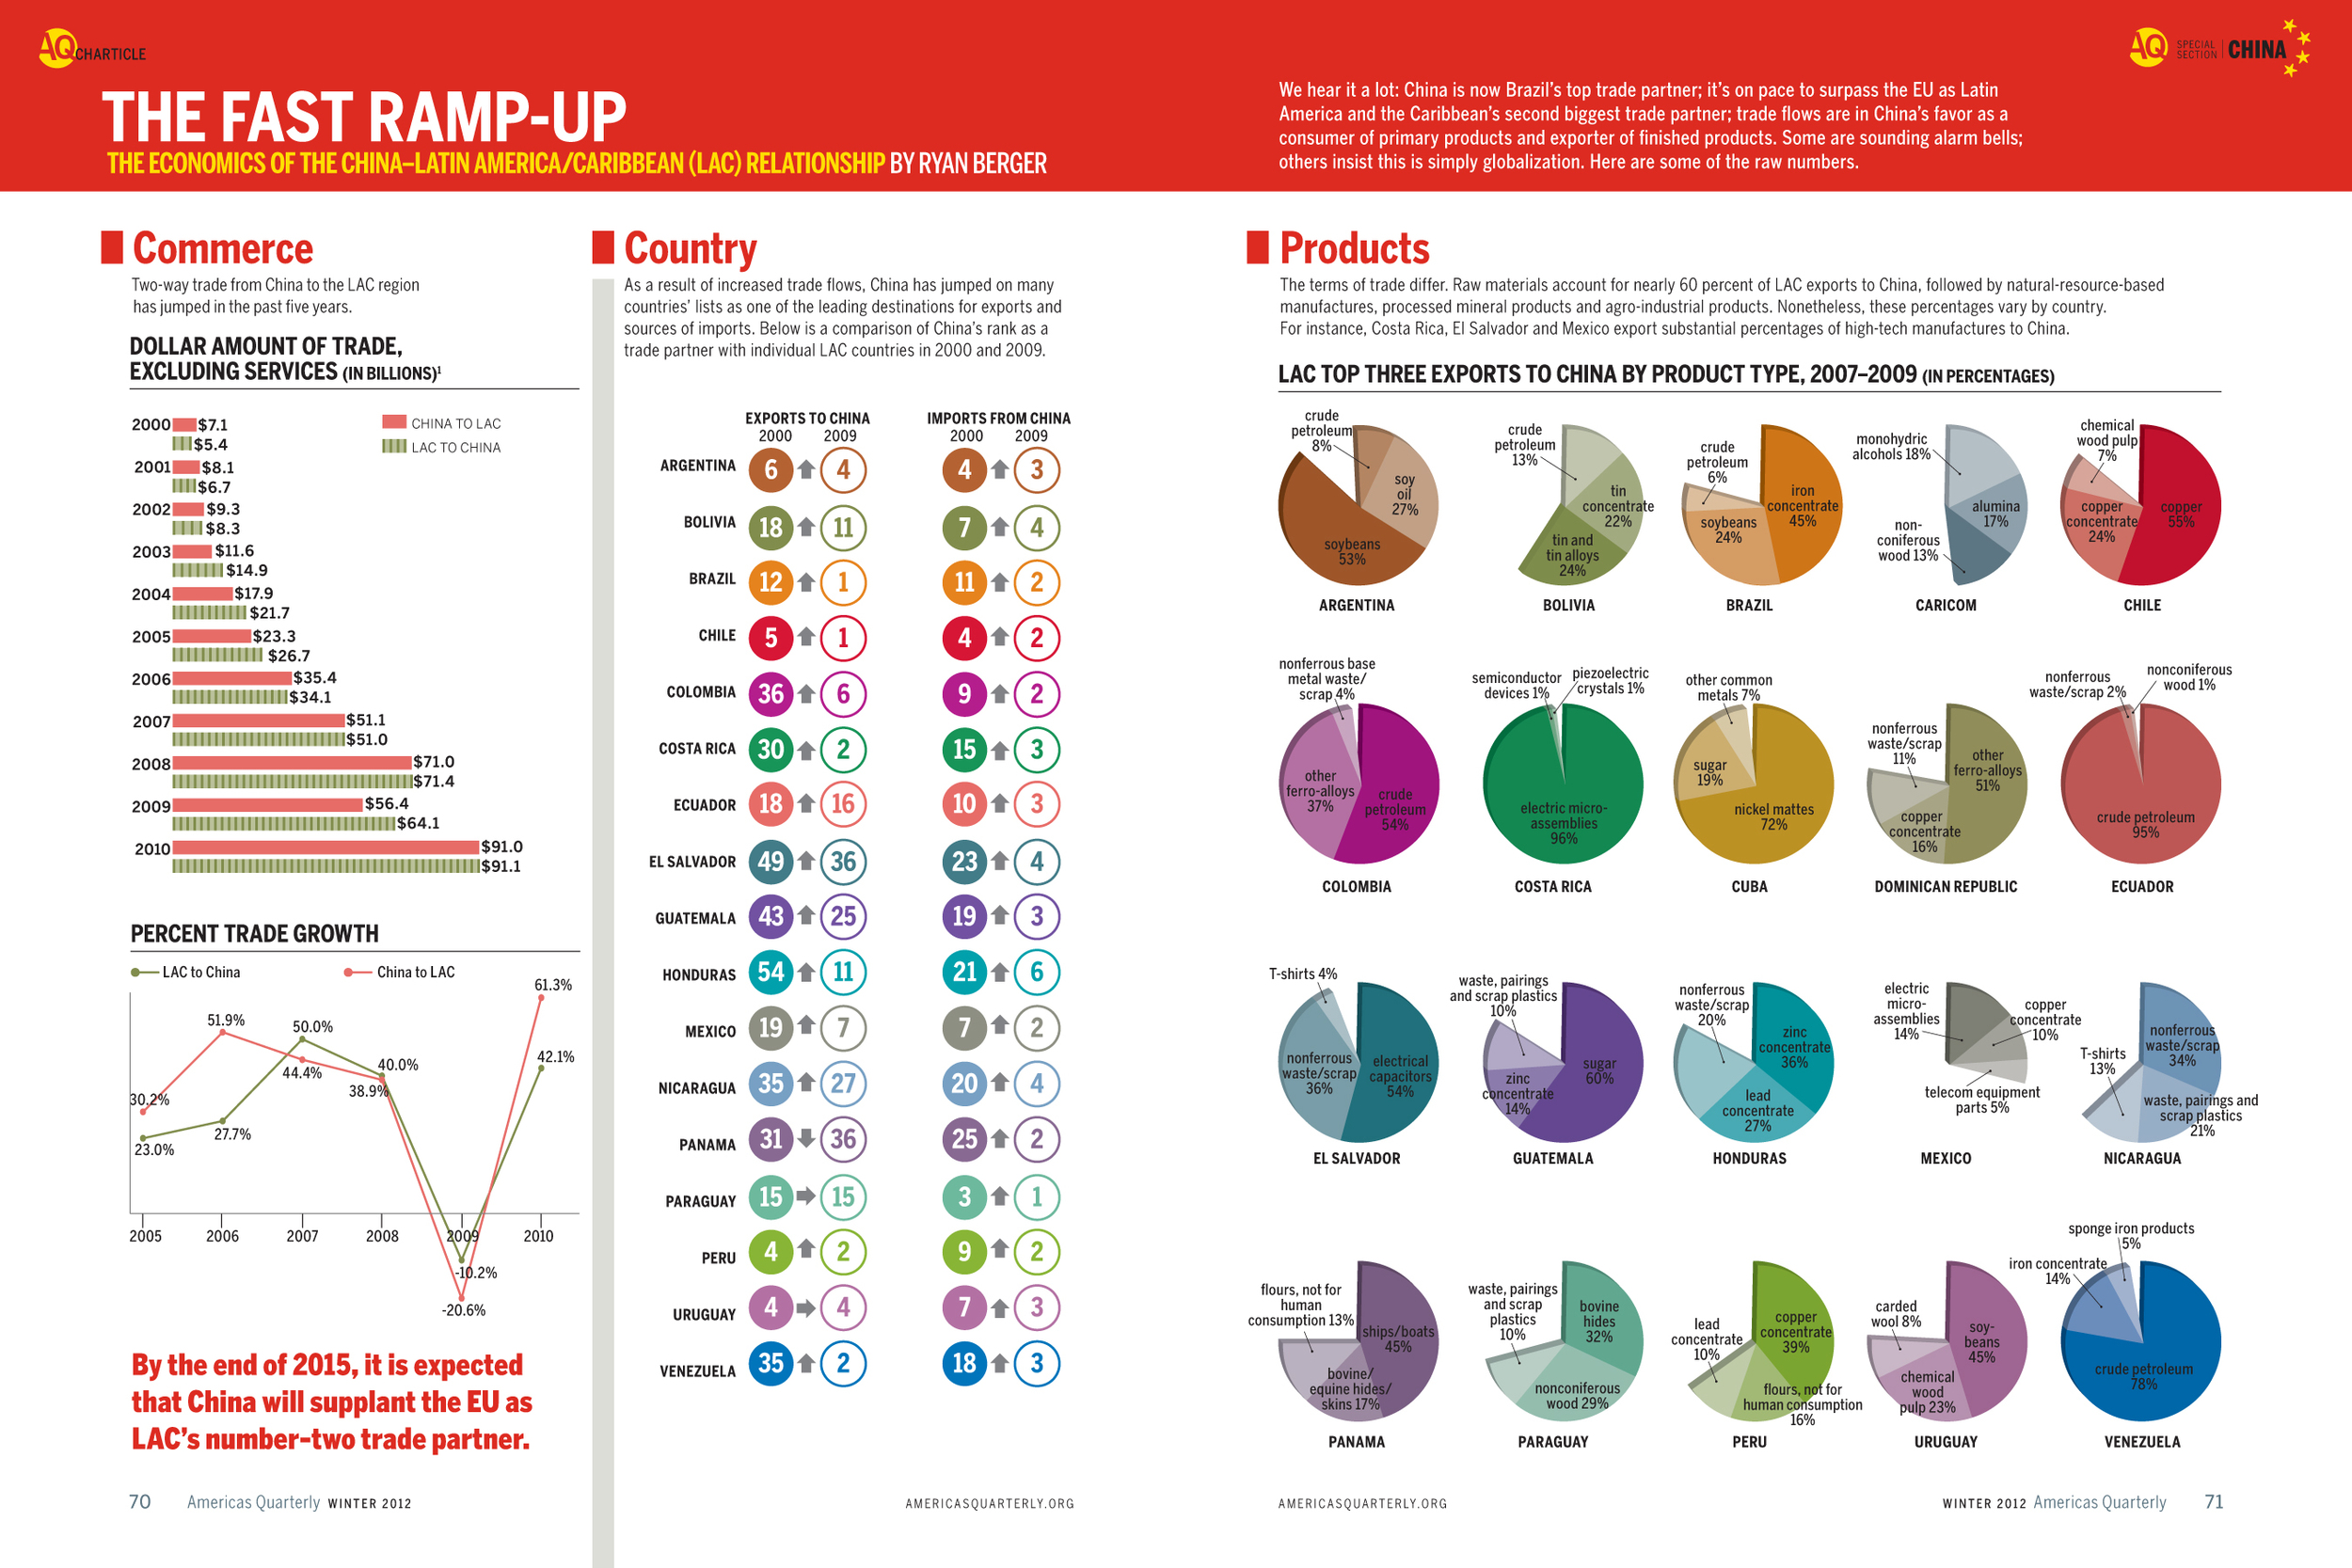
Spread envisioning the different ways that China is increasing its involvement in Latin America
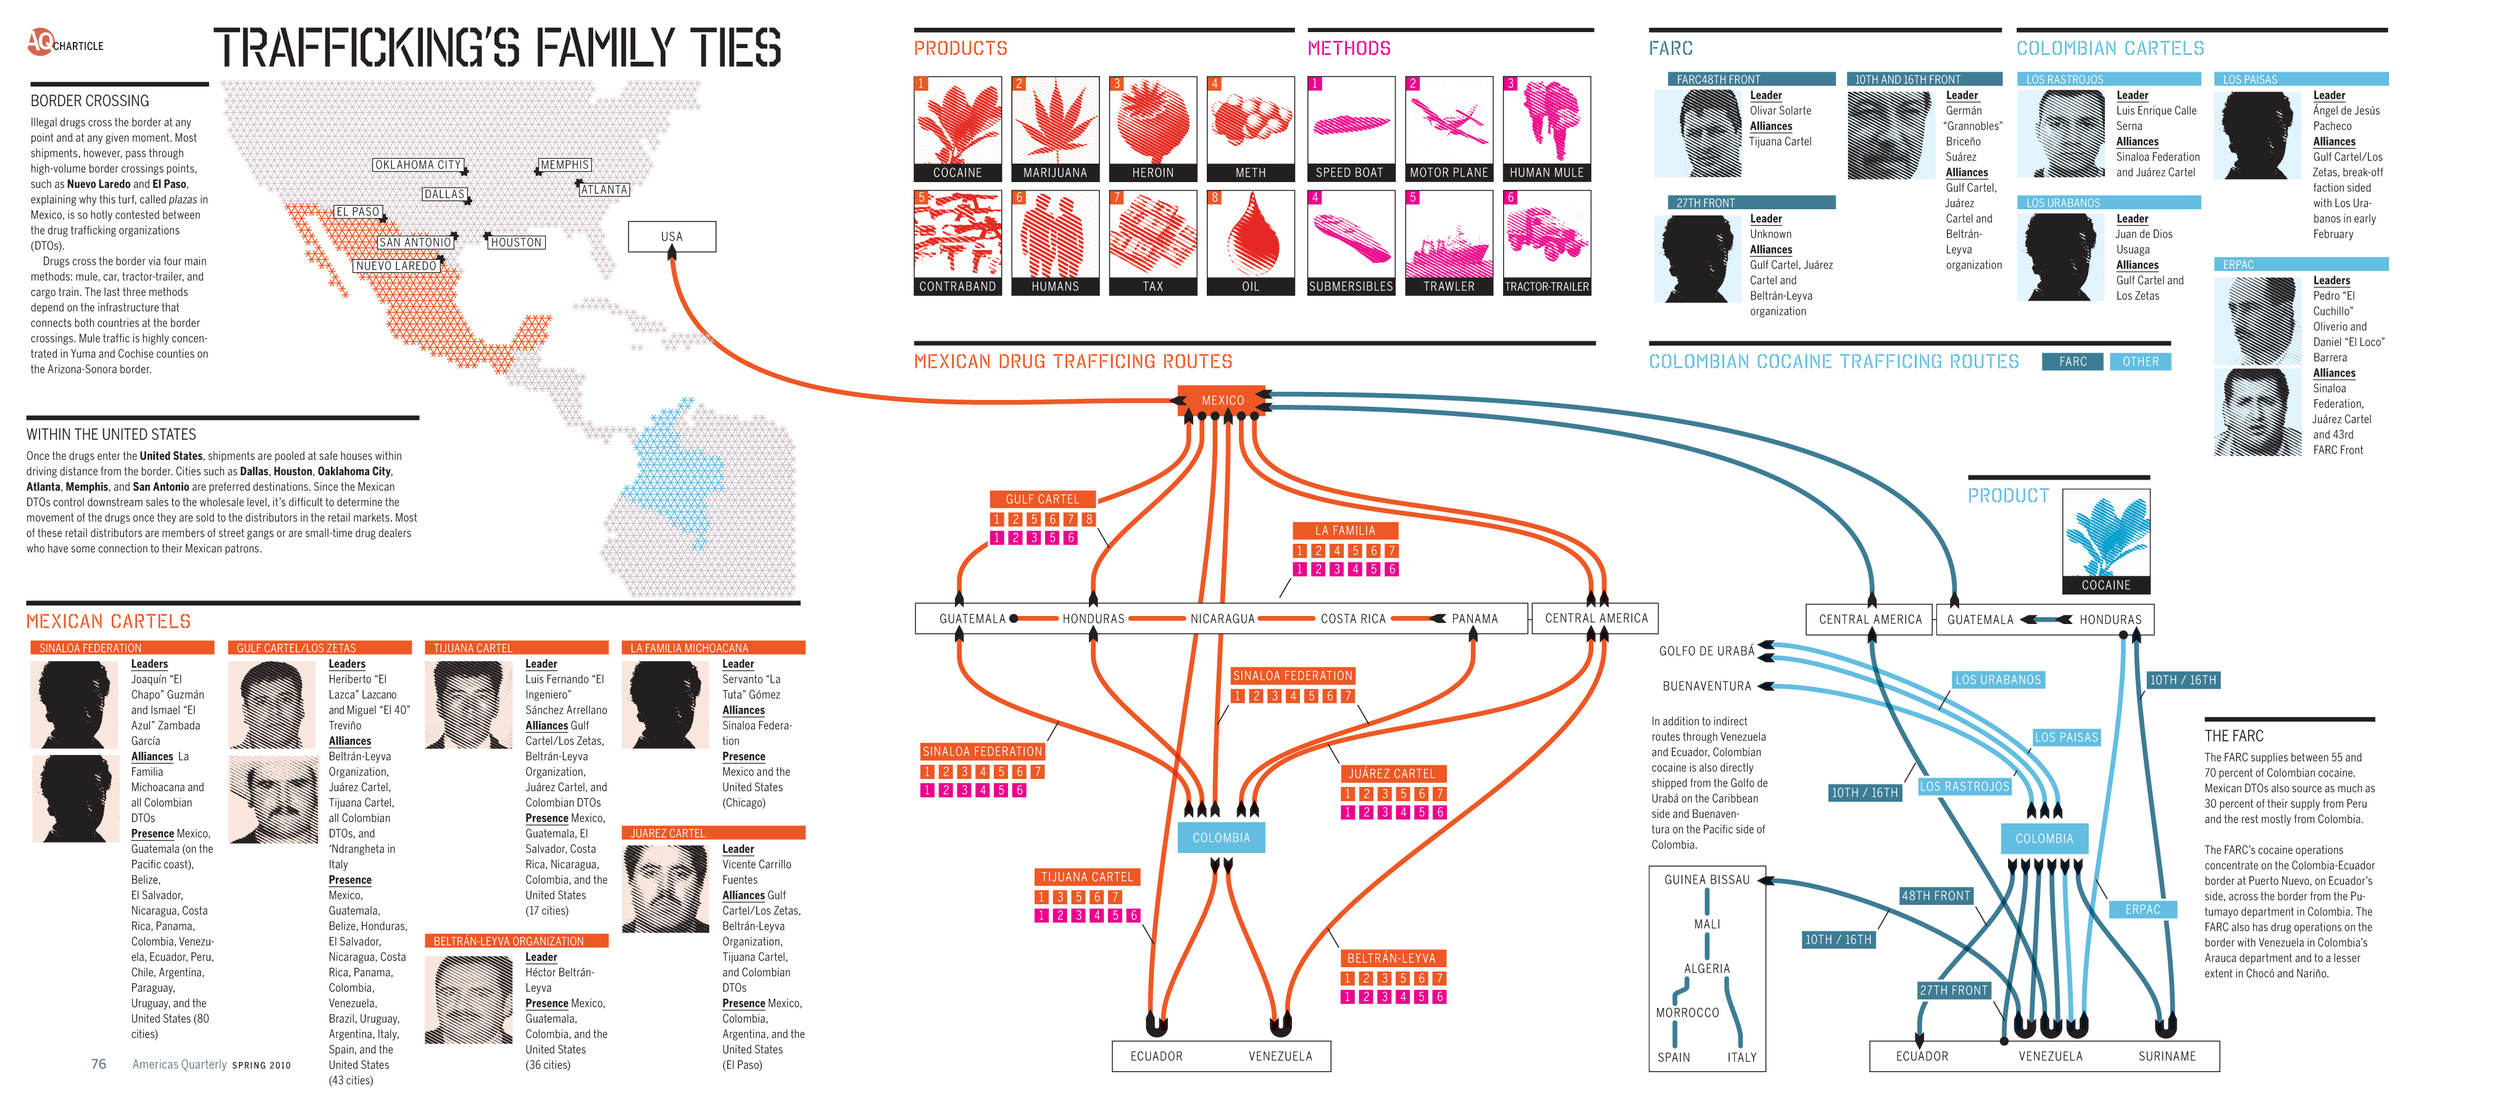
I worked with Catalogtree to map out the different drug-trafficking routes in Latin America and which cartels controlled them for a gatefold in Americas Quarterly.
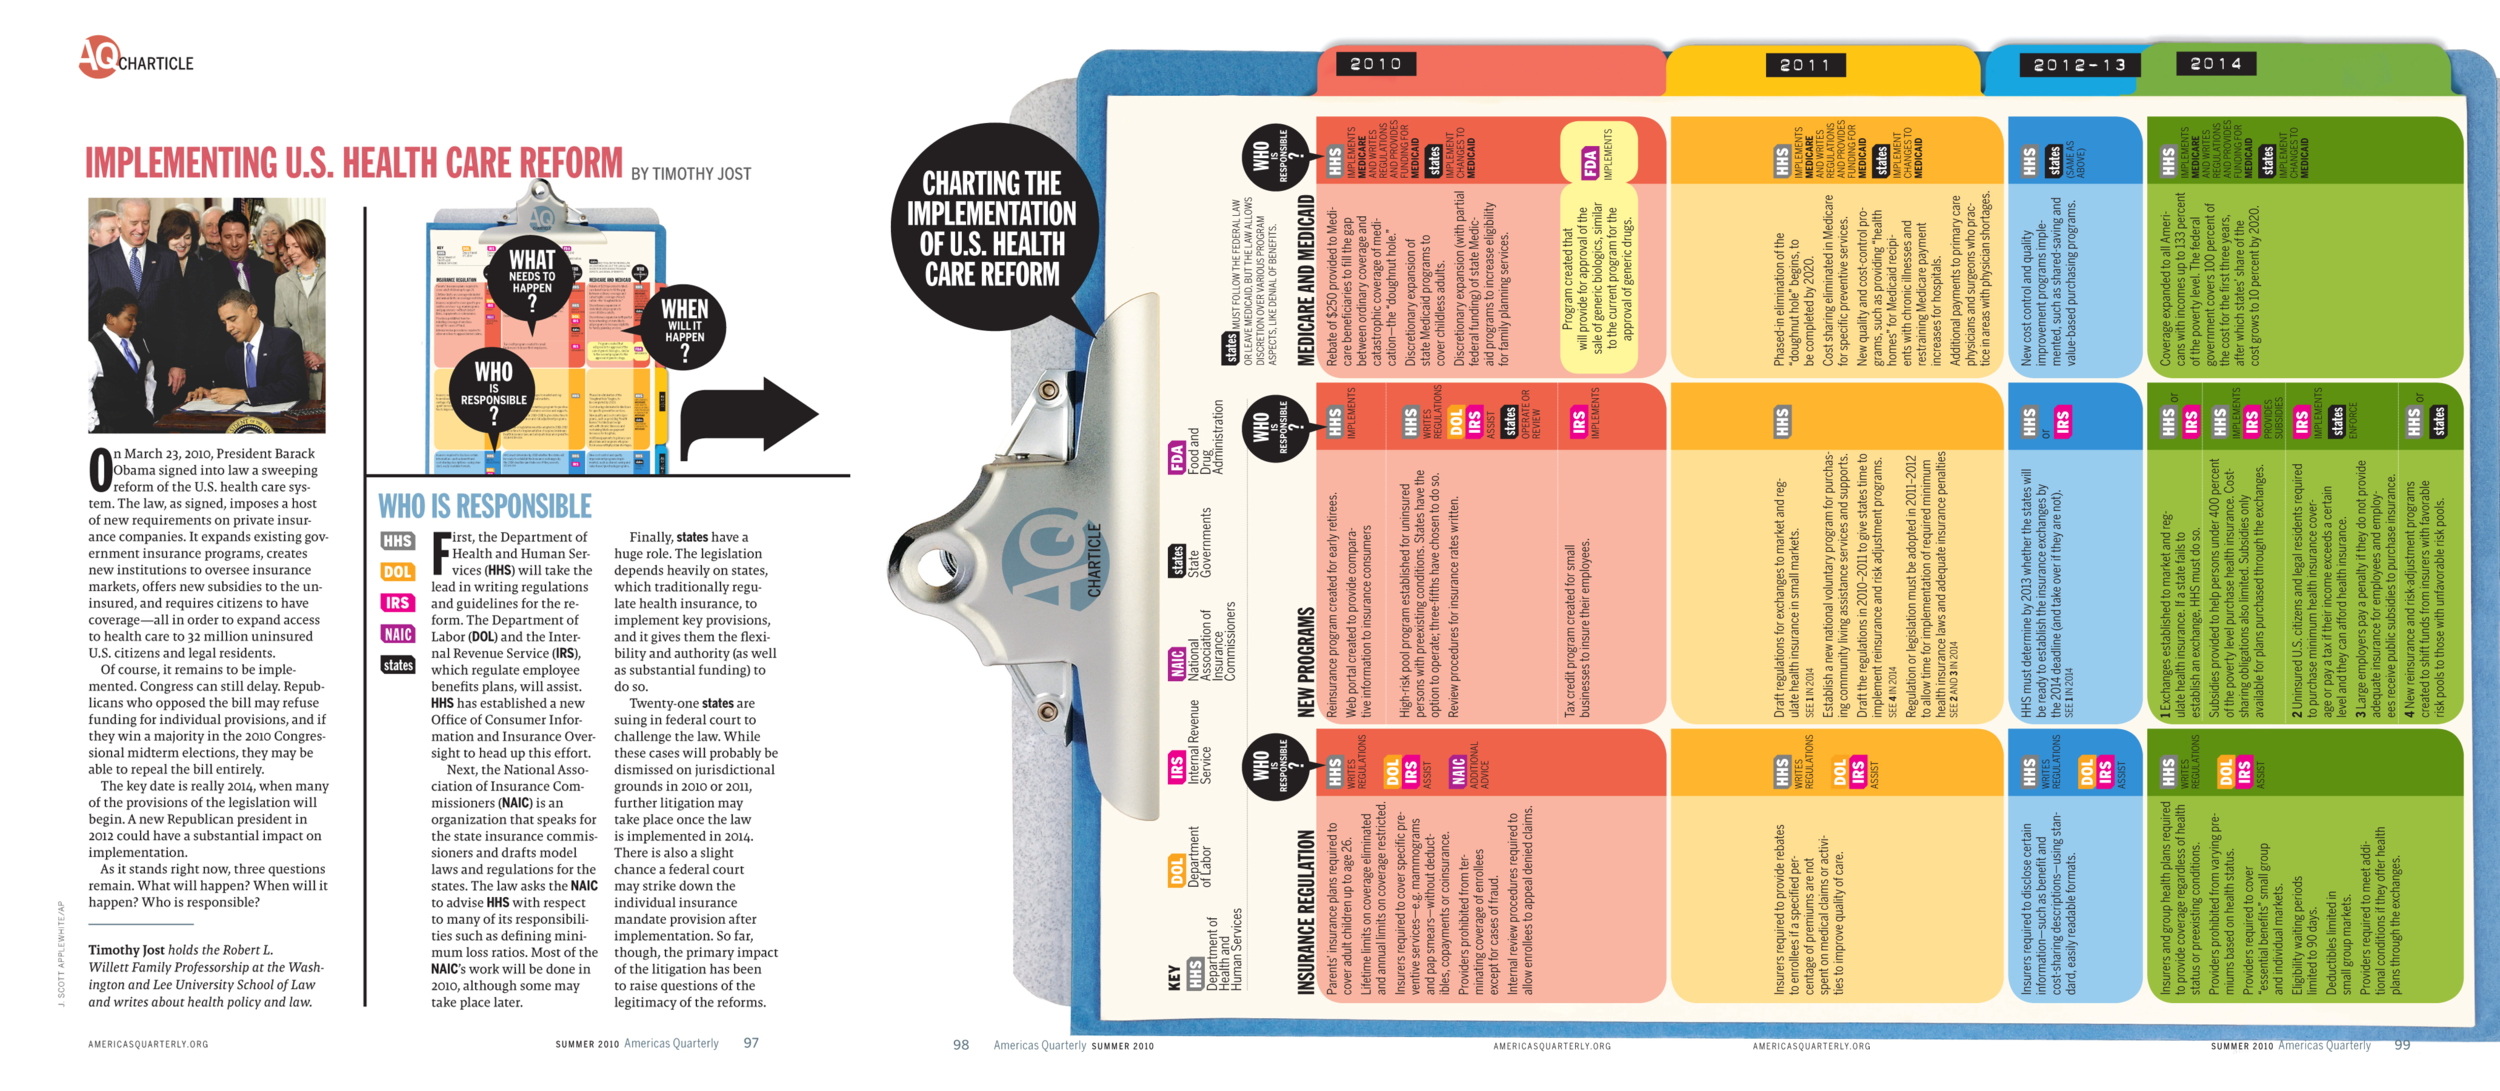
Americas Quarterly gatefold highlighting the timeline and players in health care reform. The layout was designed to be turned to keep the information on one continuous spread on the clipboard.
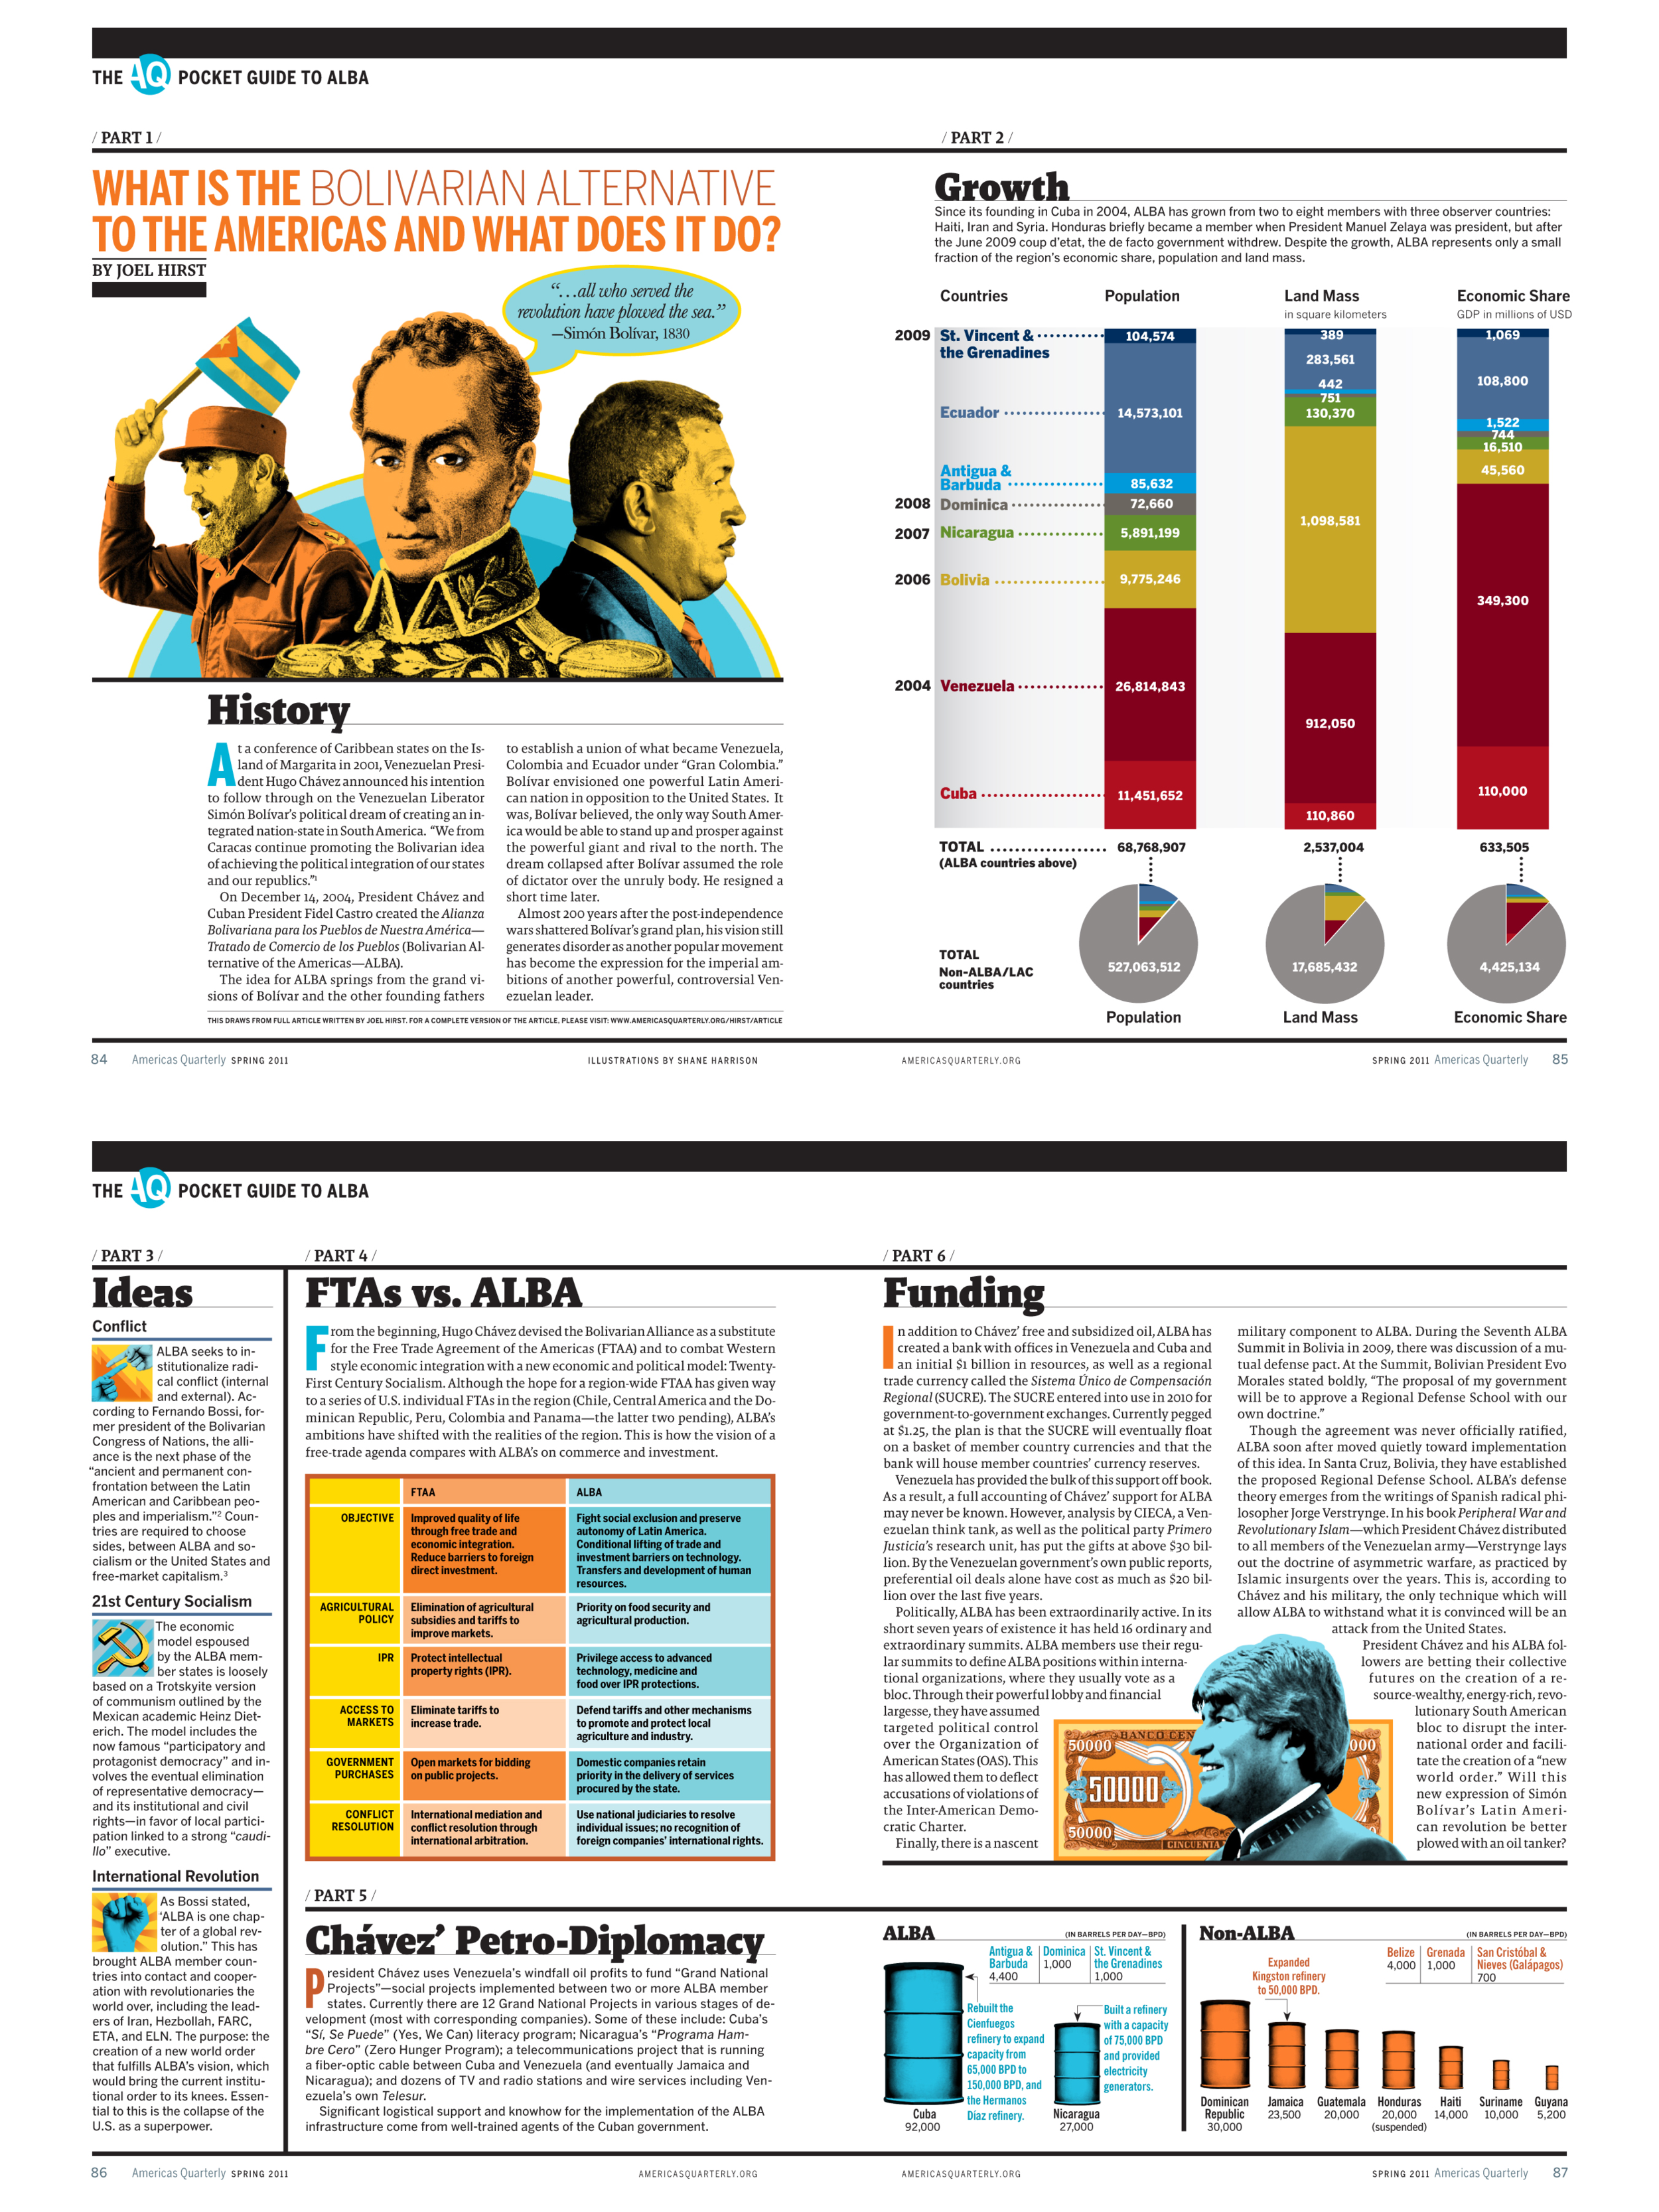
Shane Harrison's illustrations were used to make a dense topic more approachable, the Bolivarian idea of unifying Latin American countries.
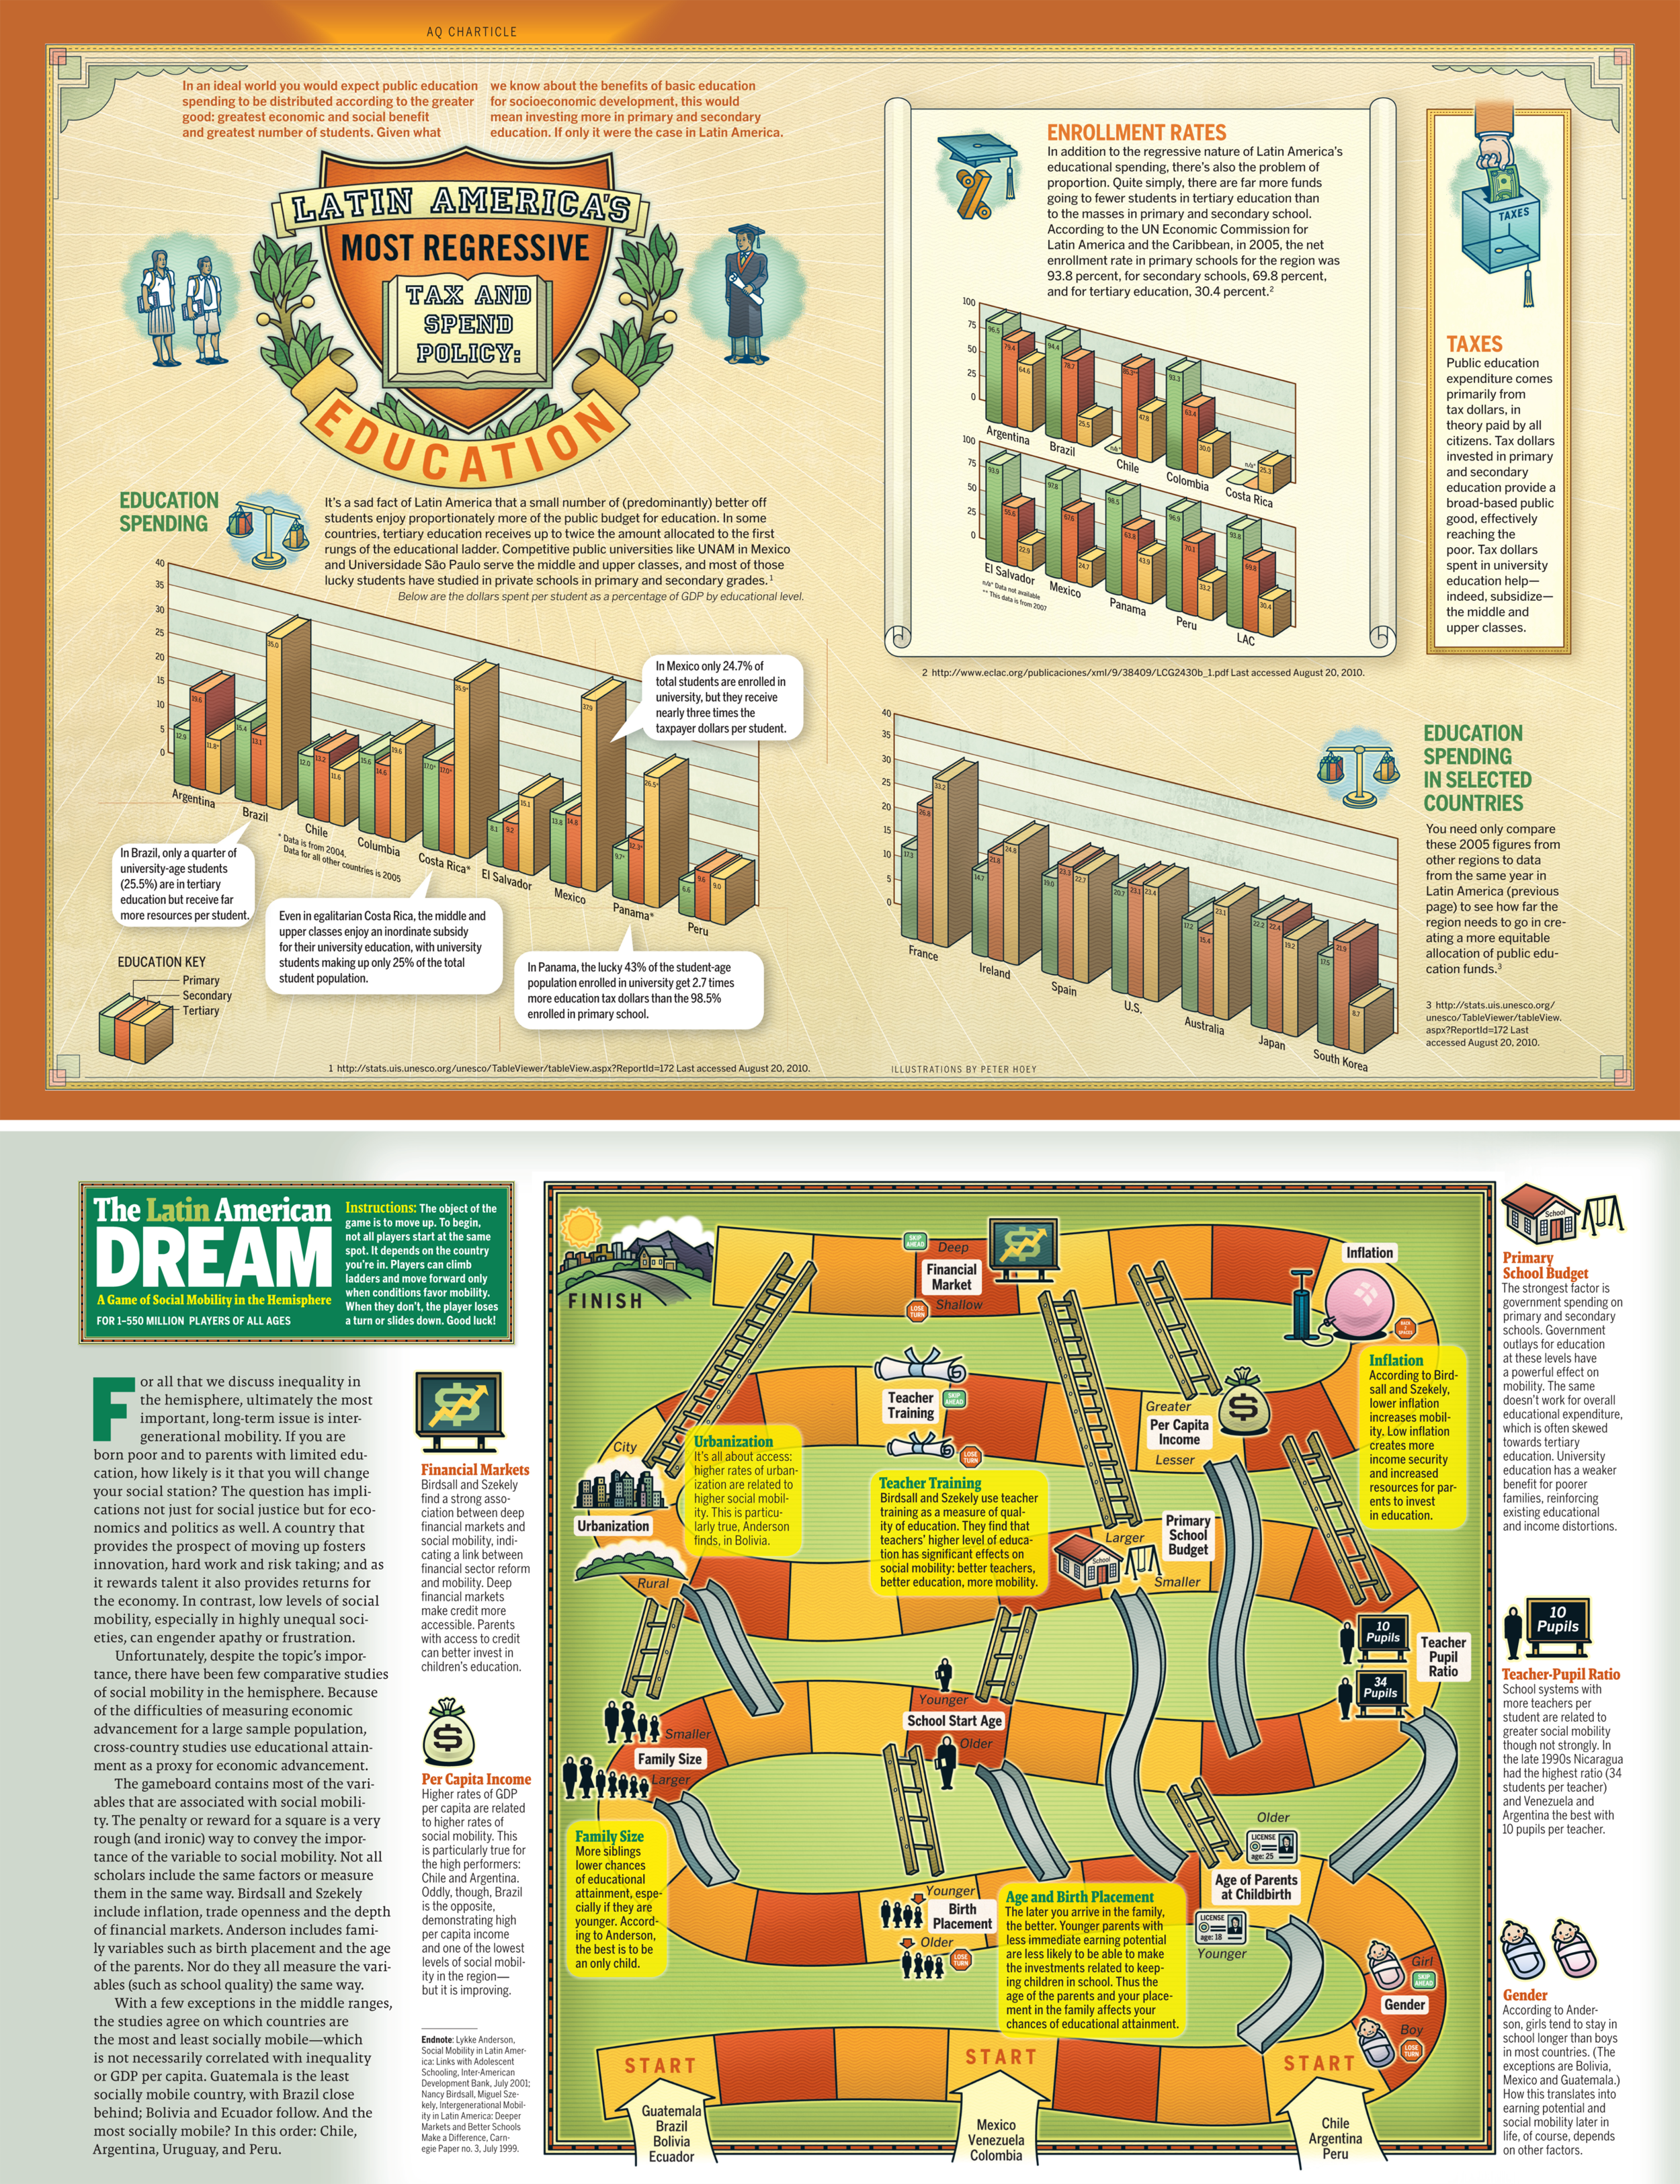
Peter Hoey illustrated these two for Americas Quarterly: Tax and spend education policies and a Chutes & Ladders gameboard we created to explain the different factors involved in social mobility.
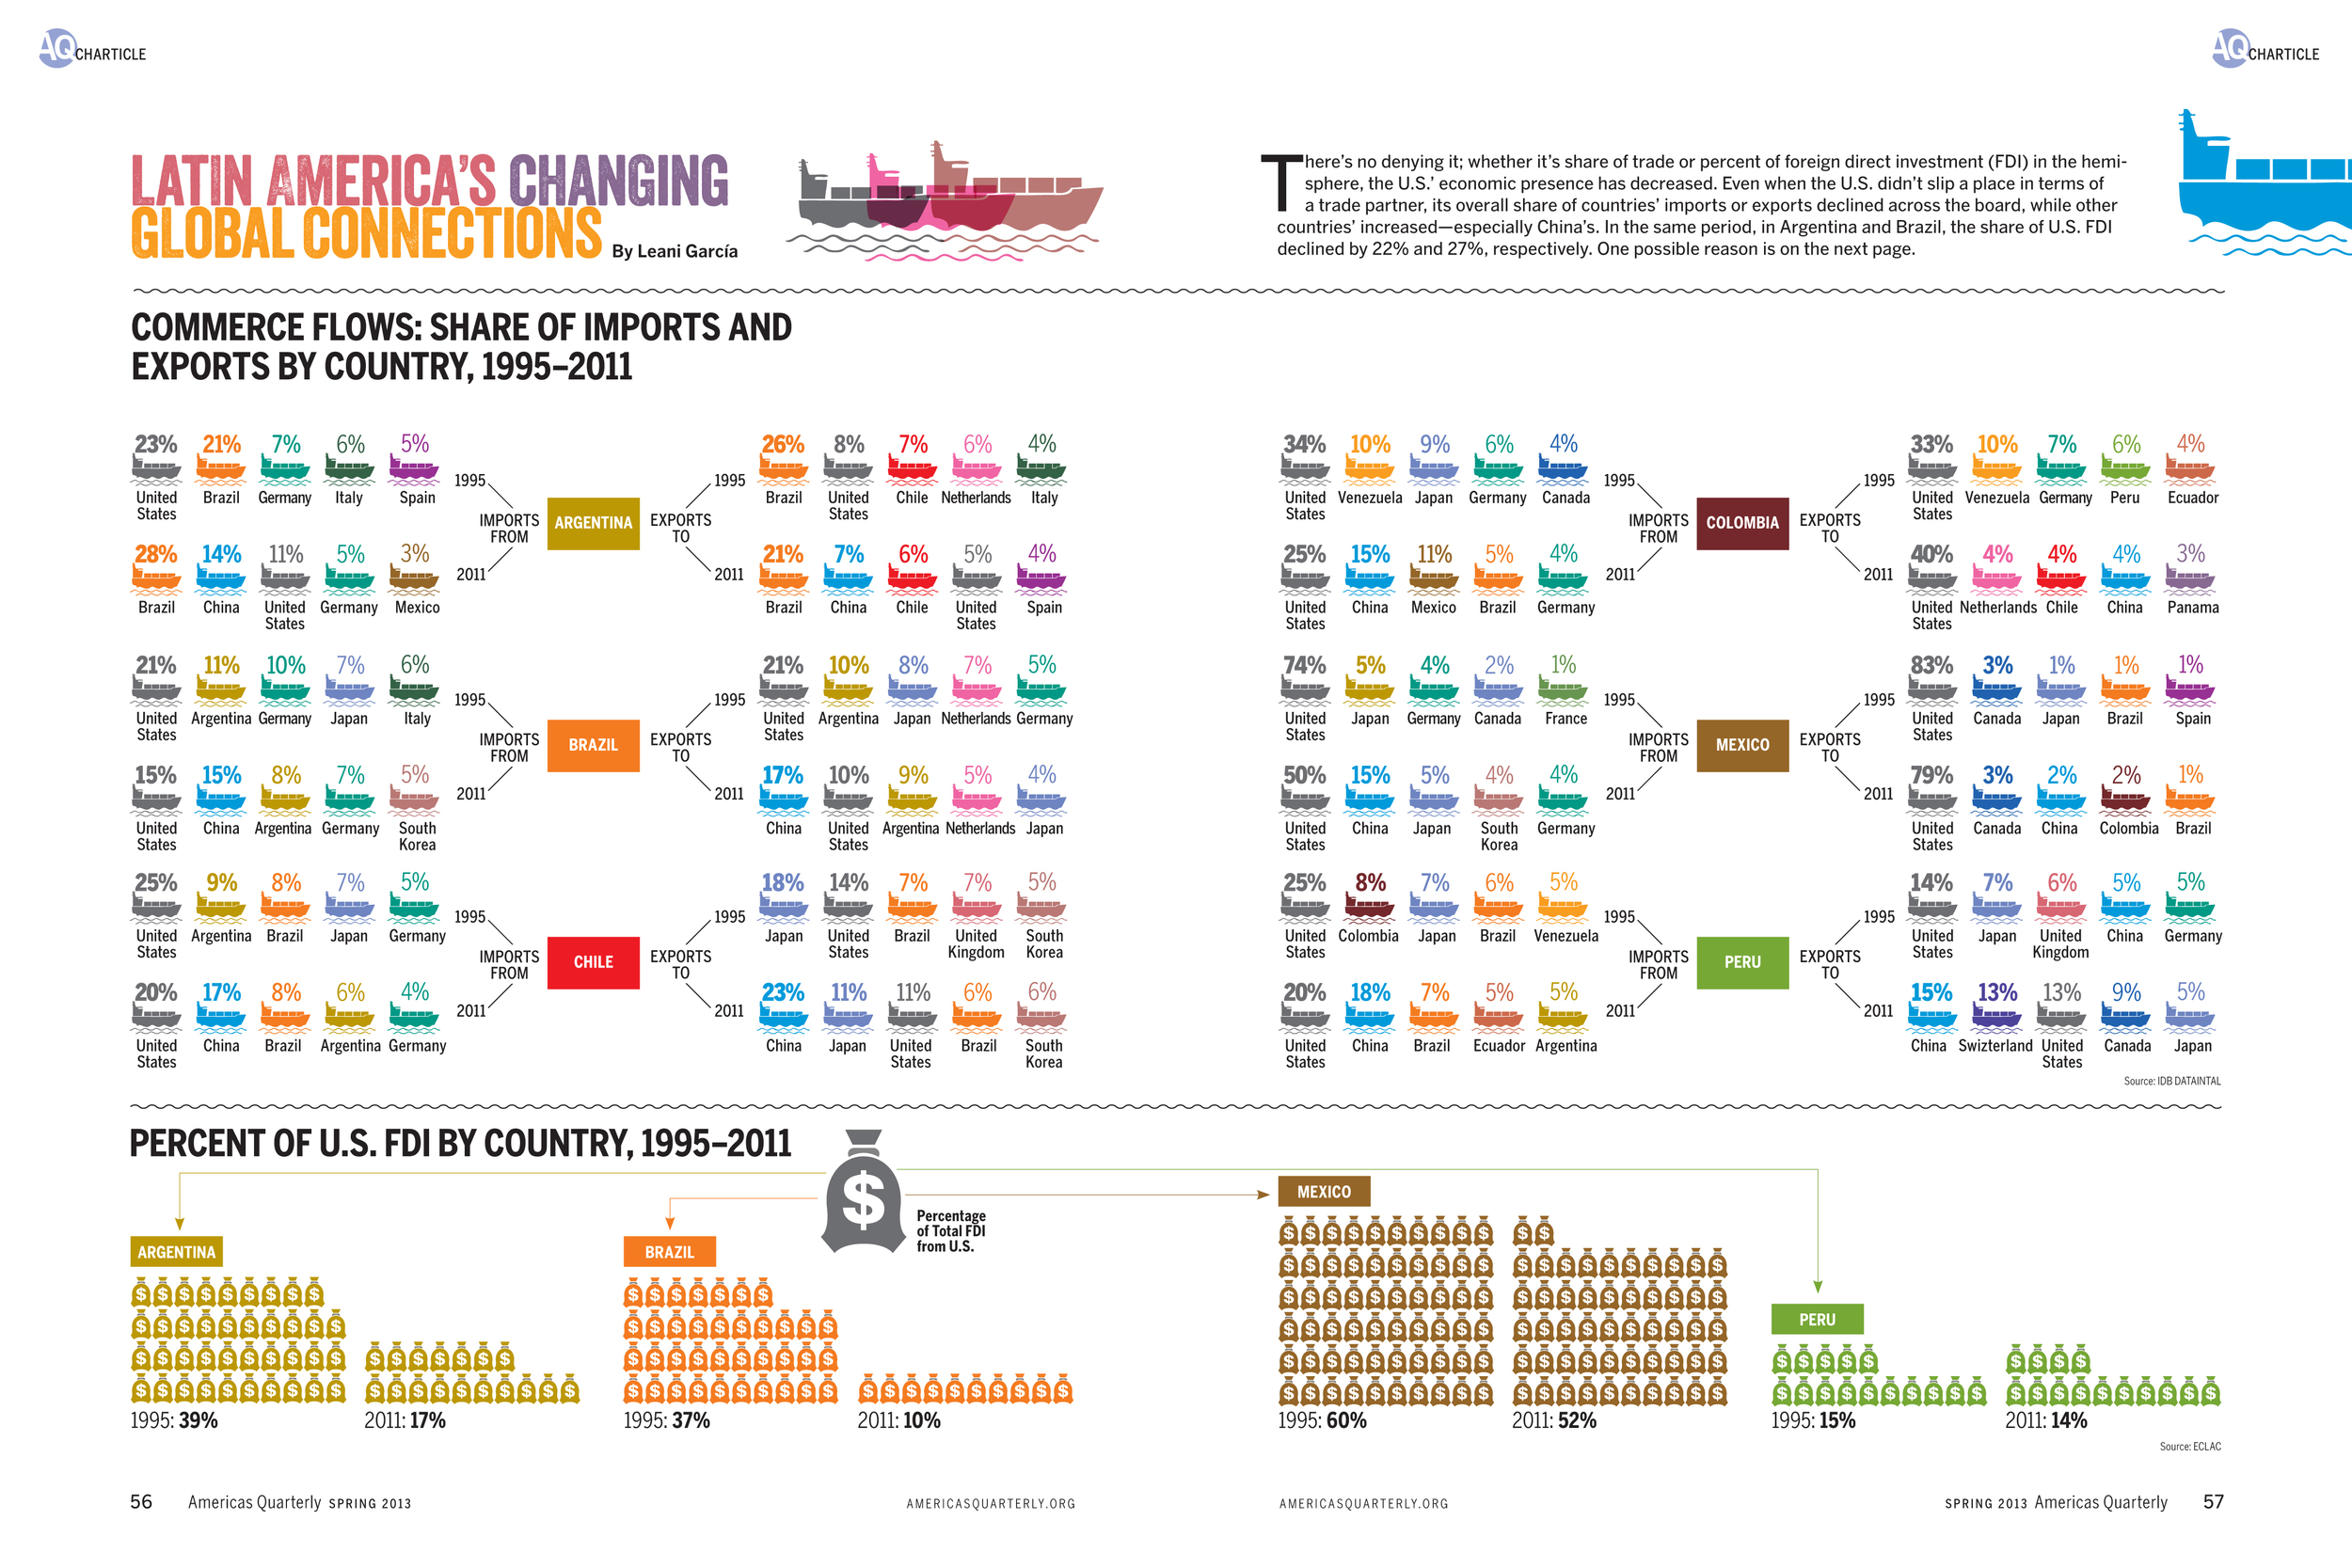
Flows of imports and exports in Latin America for Americas Quarterly
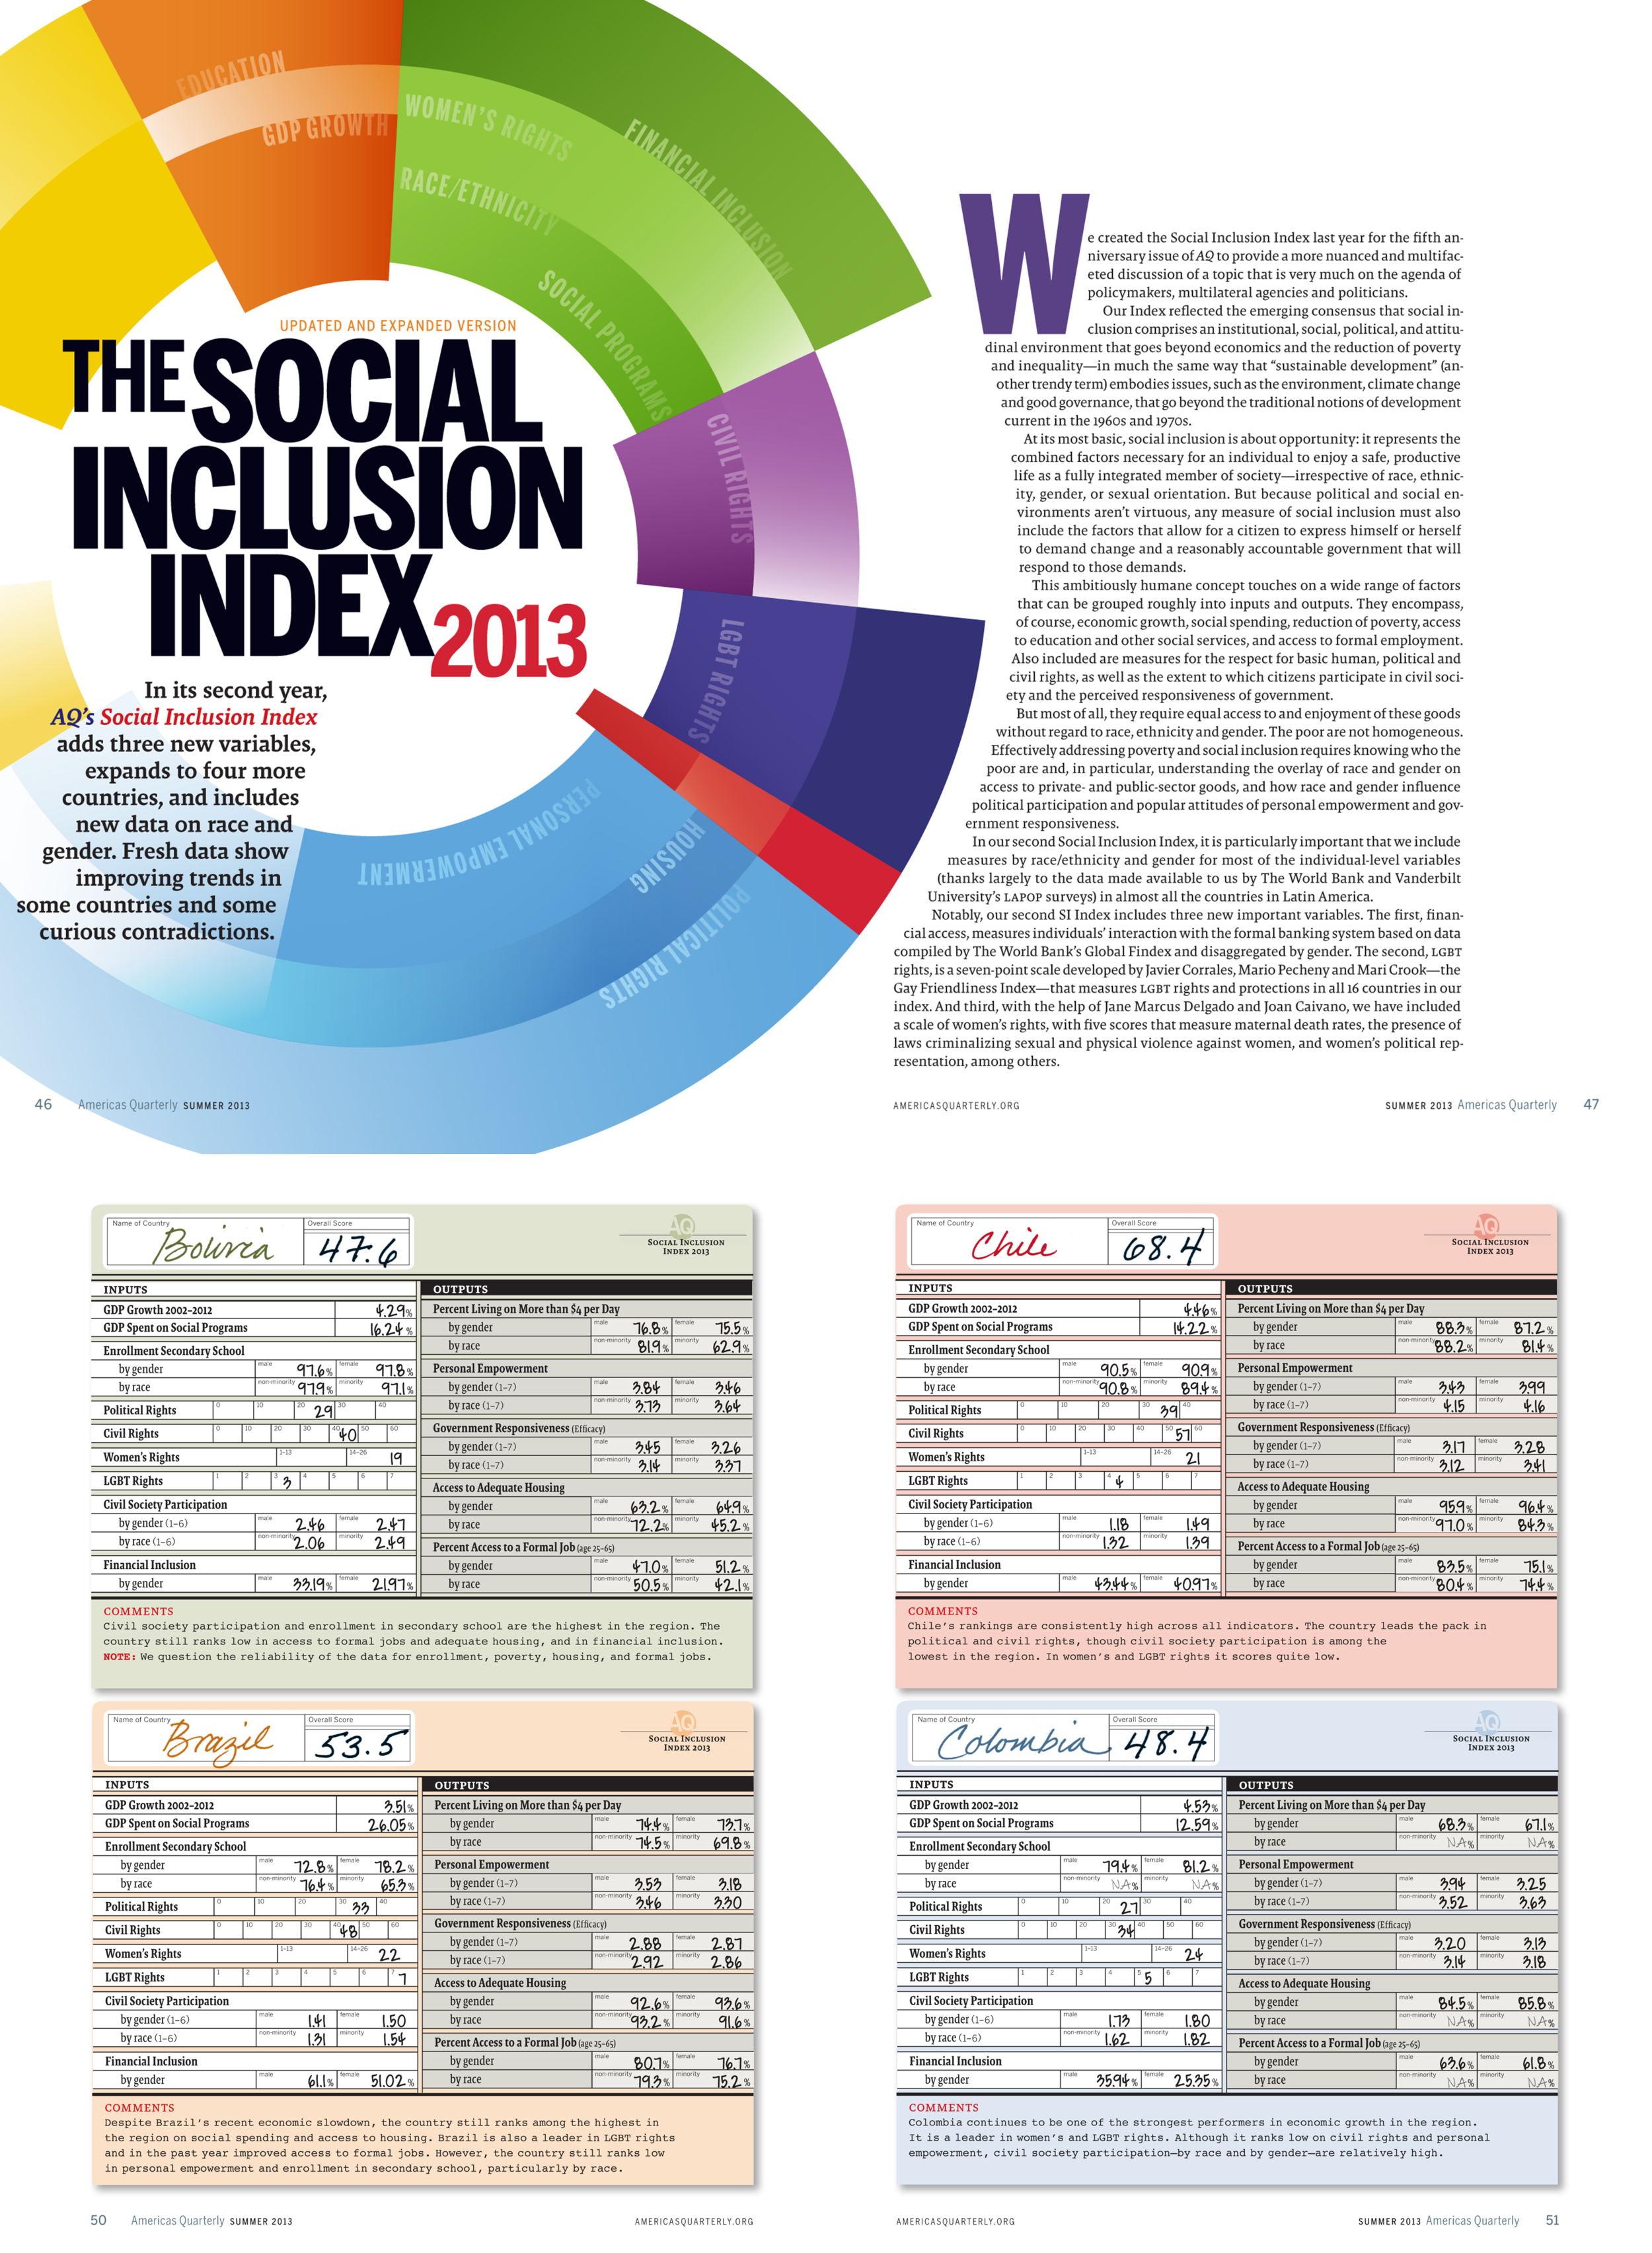
Annual feature in Americas Quarterly. Report cards were designed for each country to grade how inclusive they are.